Tools we’ve made
Welcome to our toolkit of useful things we’ve built to help your PR workflow. They’re free for anyone to use—you don’t need a CoverageBook subscription but of course they work great alongside CoverageBook
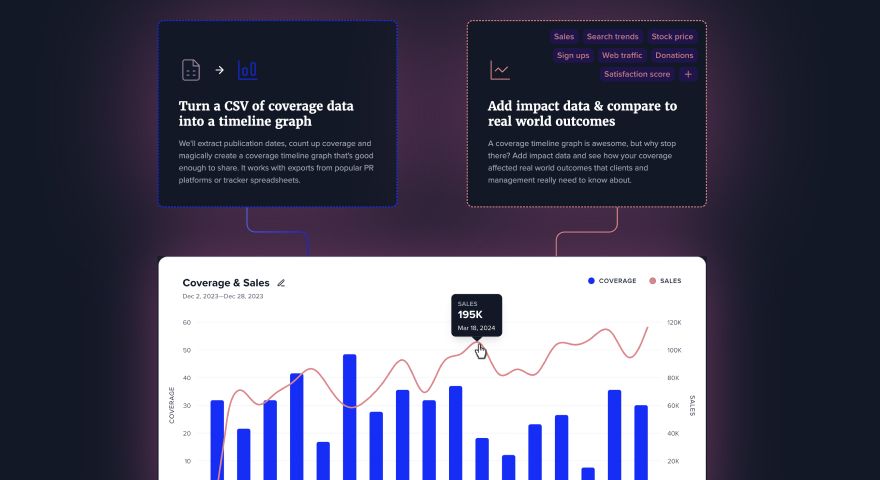
CoverageImpact
Create coverage-over-time graphs in a flash. Then layer on data like sales, web traffic or search trends and connect PR activity to organisational impact
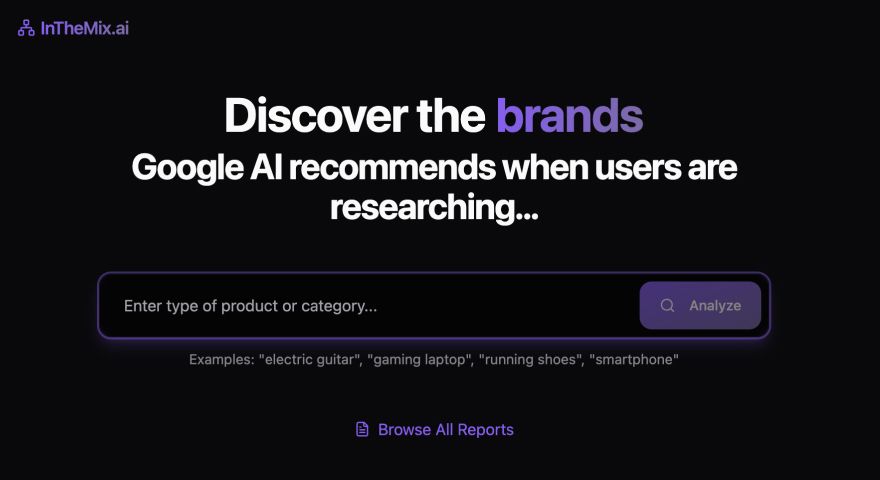
In the Mix Beta
See which media sources and publications are being referenced by AI when recommending brands, products or services in your category
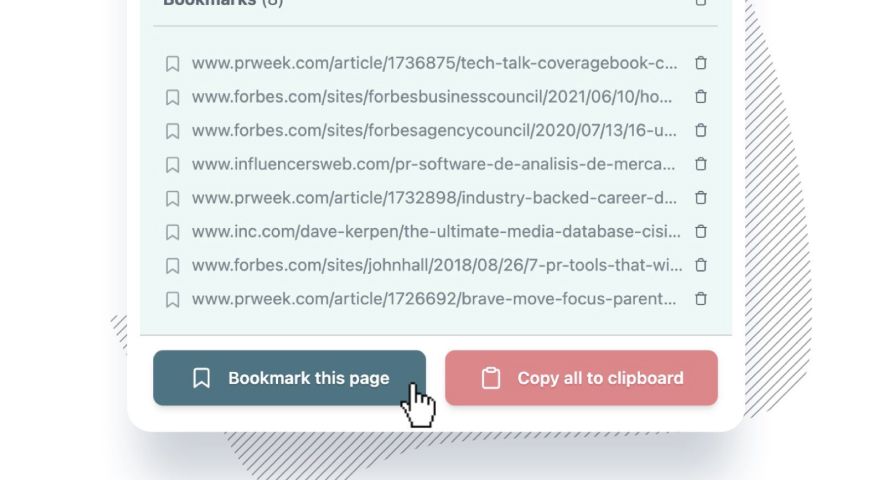
Clipper
Handy little Chrome browser extension tool that makes it easy to bookmark coverage links while you browse for mentions
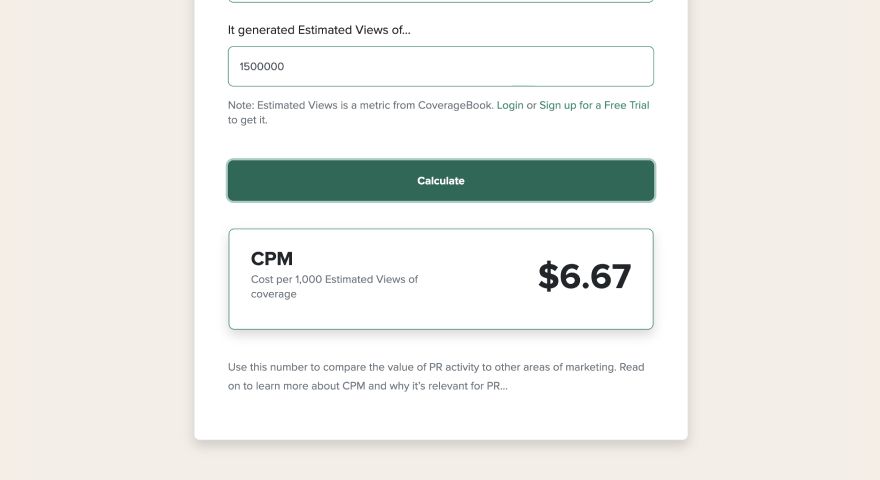
CPM Calculator
Easily calculate the cost-efficiency of your PR coverage with a simple cost per impressions metric—helping you compare PR impact with other channels
PR Benchmarks
Research project analysing a huge sample of coverage so you can see how your results compare to the rest of the PR industry
Link Extractor
Transform hyperlinks like Amazing PR reporting tool back into a plain URLs like https://coveragebook.com/
Previous hits

AnswerThePublic Sold, 2022
AnswerThePublic was our curious little brainchild — built to help marketers uncover the questions people are really asking. We’ve since passed the mic to NP Digital, who are taking great care of it. We’re proud parents, waving from the sidelines. 👋❤️
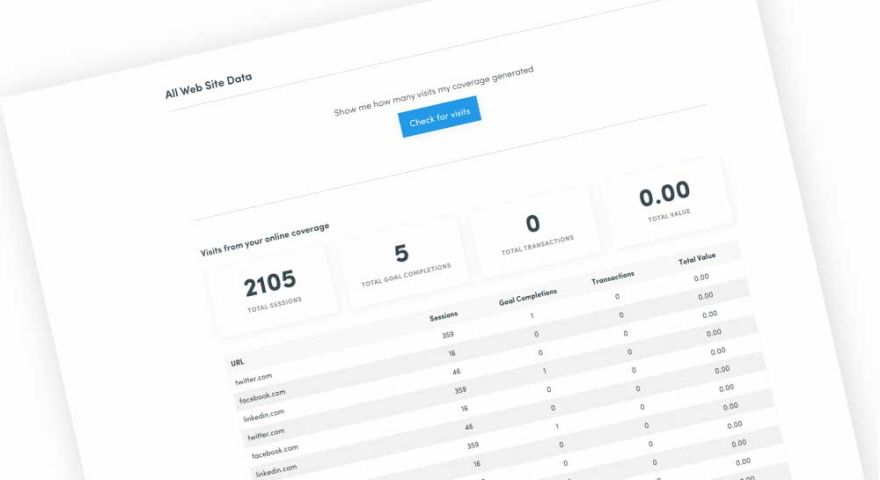
AnswerTheClient
A clever little tool that helped non Google Analytics wizards understand the value of their press coverage — no analytics degree required. It bowed out gracefully when Universal Analytics called it a day.
CoverageBot
Before AI chatbots were all the rage, this helpful little guy gave you coverage stats in a conversational interface, then packaged the data up in a nice email for you. Were we too early to the AI party? Maybe…
Copy & Paste Hero
We teamed up with RamJam to create the worst game ever—intentionally. A glorious ode to the futility of copy-paste, wrapped in charming Windows 95 vibes. Pointless? Exactly. That’s the point.