Showcase your PR wins, across a range of media channels

Add online articles, social media mentions, magazine features, TV clips, podcasts and more—all in one powerful reporting tool. CoverageBook makes it easy to showcase & measure your PR impact with clarity & confidence.

Start your free trial
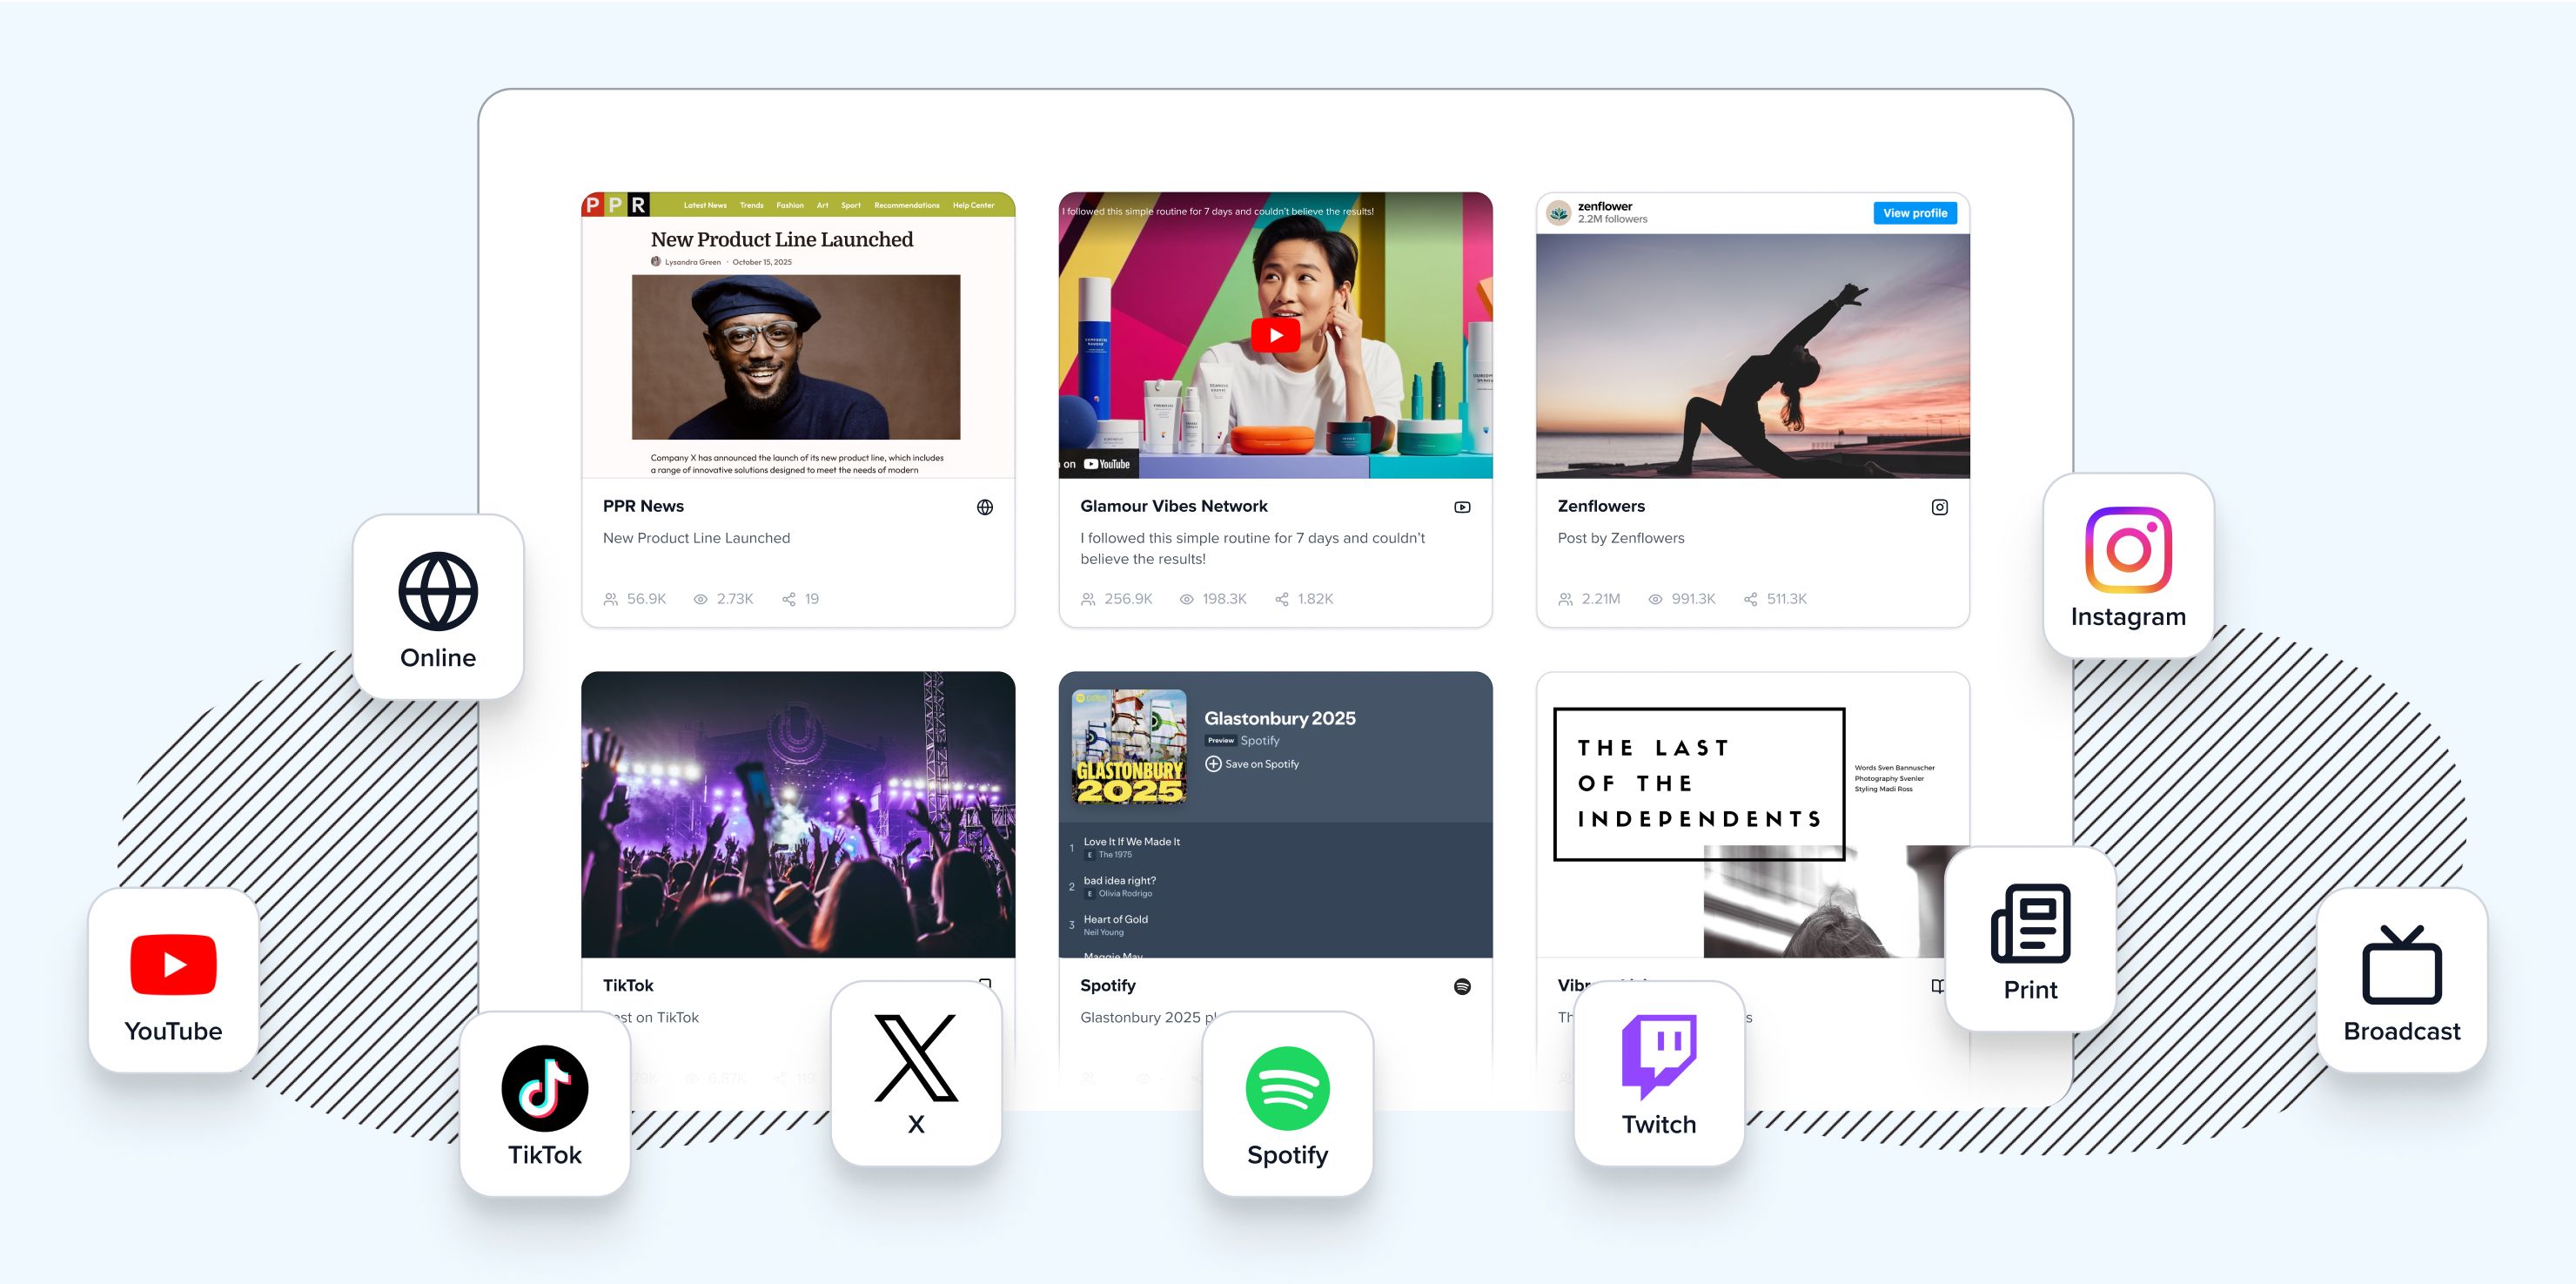
Various types of coverage in CoverageBook plus logos for online, print, broadcast, YouTube, Instagam, TikTok, Twitch, Spotify and X

See how things look for different platforms and media types

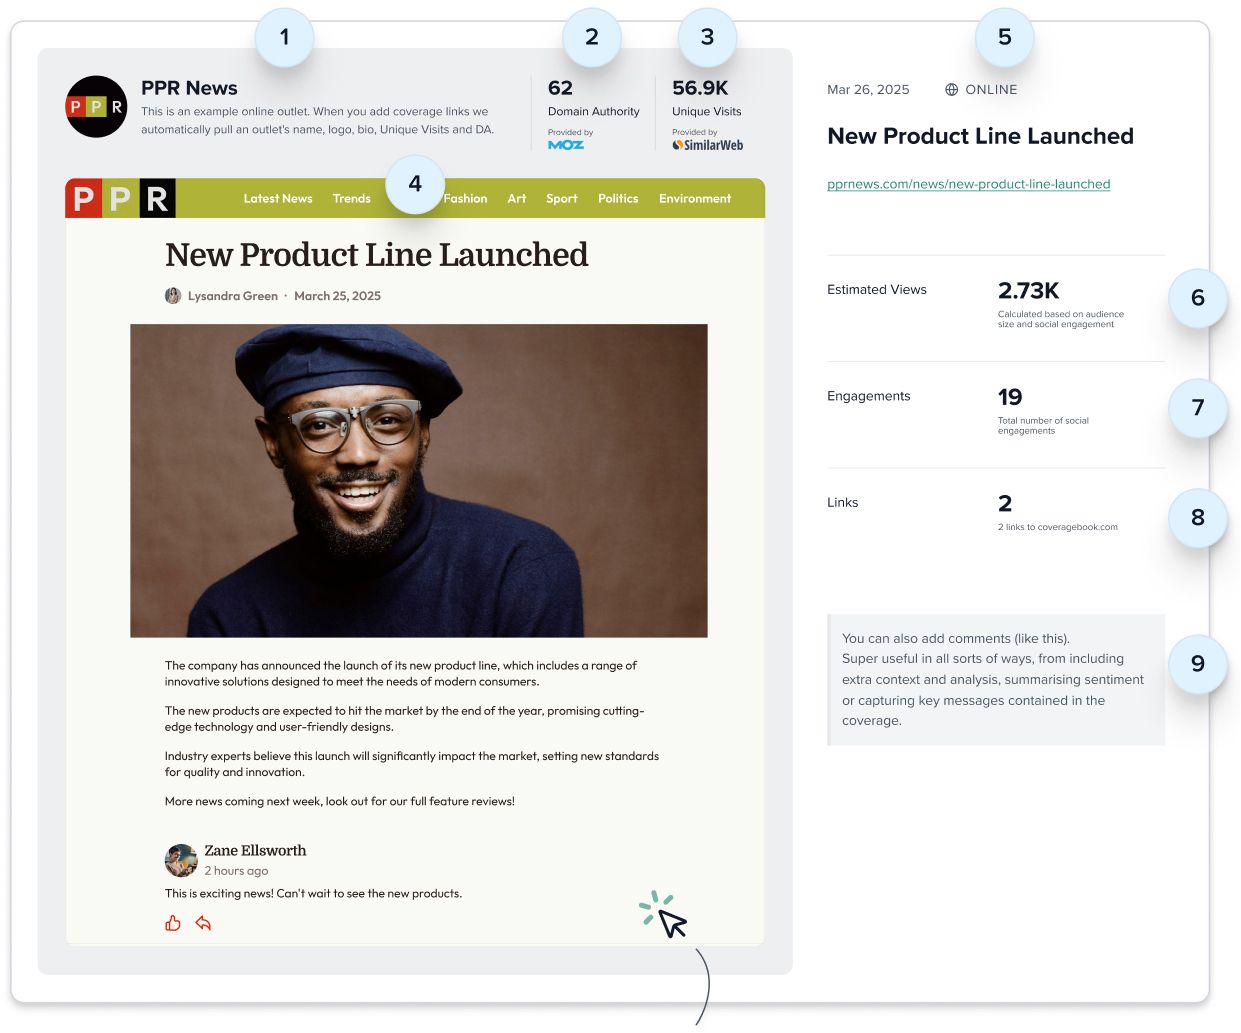
Example of online coverage with screenshot and data collected

We capture full-page screenshots, readers can click to see the full image

Globe iconOnline

Add links to online articles to capture...

  1. Outlet data: publication name, logo and description, plus Domain Authority and Unique Visits

  2. Full-length screenshot: adjustable to showcase your mention

  3. Coverage details: publication date, article title and automatically detected Coverage Type

  4. Coverage analysis: Brand Prominence and Sentiment to capture how visible your brand was and how it was portrayed

  5. Coverage metrics: Estimated Views, Engagements and Links, plus any custom metrics you add

  6. PR activity: the tactic, pitch or other activity associated with the coverage

  7. Comments: add your own context and analysis

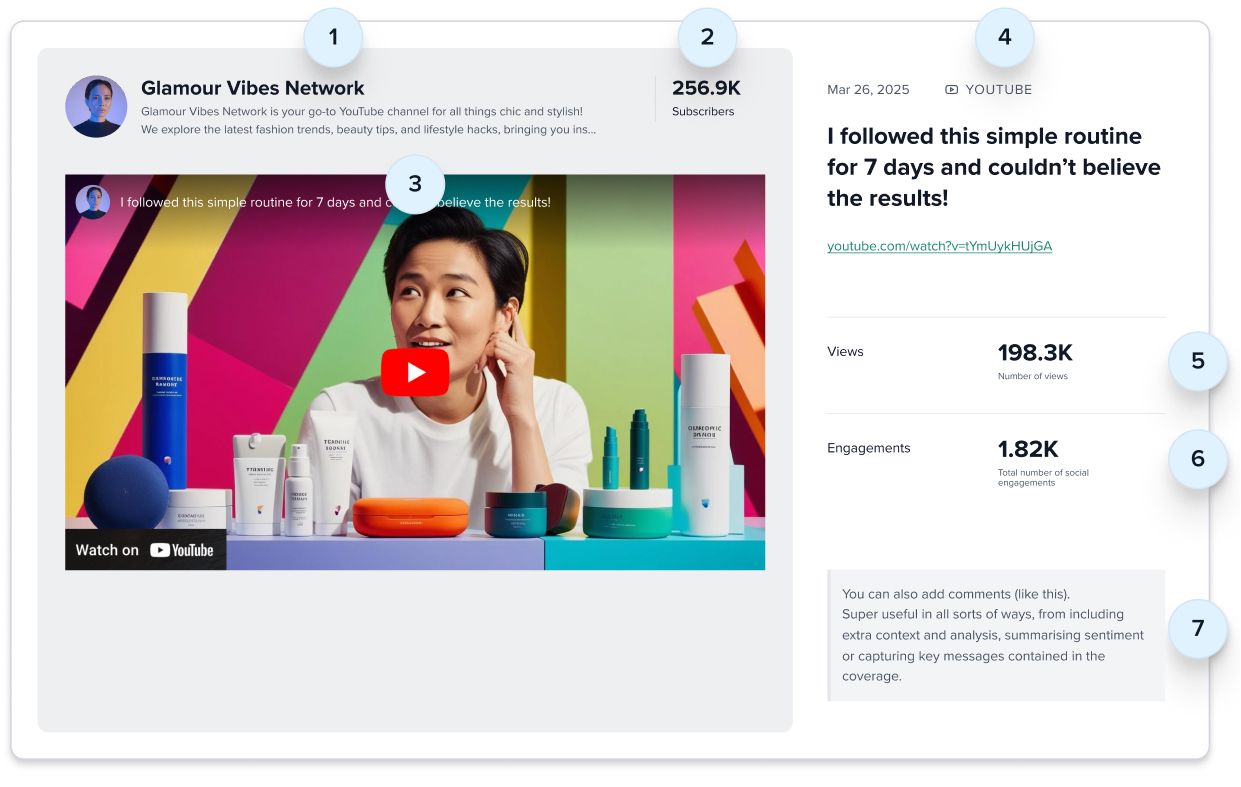
Example of YouTube coverage with video embedded and data collected

YouTube videos are embedded, so they can be played within your report

YouTube logo iconYouTube

Add links to YouTube videos and shorts to capture...

  1. Channel data: name, logo, description and Subscriber count

  2. Video embed: playable within your report

  3. Coverage details: date posted, video title and Coverage Type

  4. Coverage analysis: Brand Prominence and Sentiment to capture how visible your brand was and how it was portrayed

  5. Coverage metrics: Views and Engagements, plus any custom metrics you add

  6. PR activity: the tactic, pitch or other activity associated with the coverage

  7. Comments: add your own context and analysis

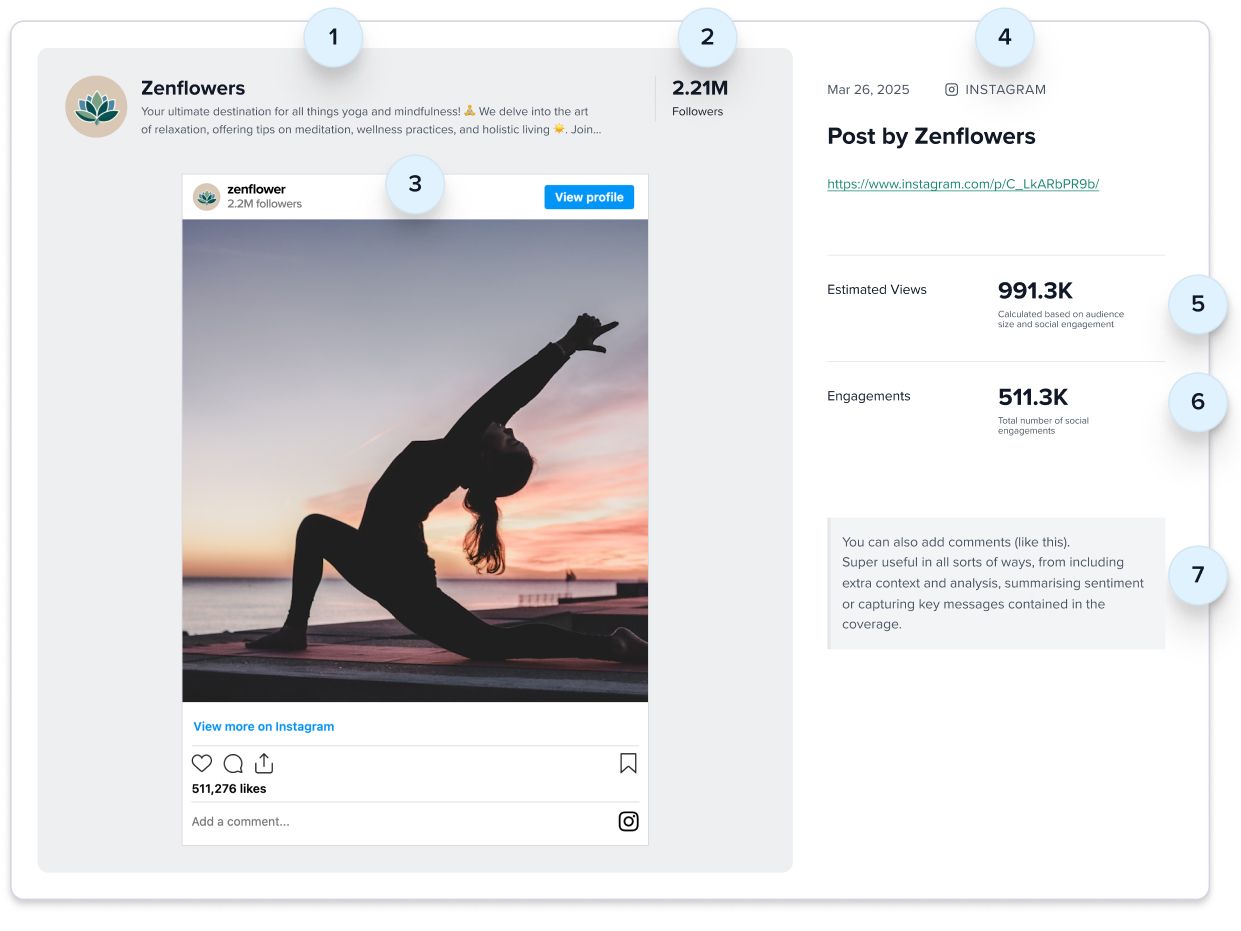
Example of Instagram coverage with post embedded and data collected

Instagram posts are embedded, so they can be played within your report

Instagram logo iconInstagram

Add links to Instagram posts to capture...

  1. Profile data: name, logo, description and Follower count

  2. Live embed: video content plays within your report

  3. Coverage details: date posted, post title and Coverage Type

  4. Coverage analysis: Brand Prominence and Sentiment to capture how visible your brand was and how it was portrayed

  5. Coverage metrics: Estimated Views and Engagements, plus any custom metrics you add

  6. PR activity: the tactic, pitch or other activity associated with the coverage

  7. Comments: add your own context and analysis

Note: Instagram Stories are temporary, we can only capture images/videos while the content is live

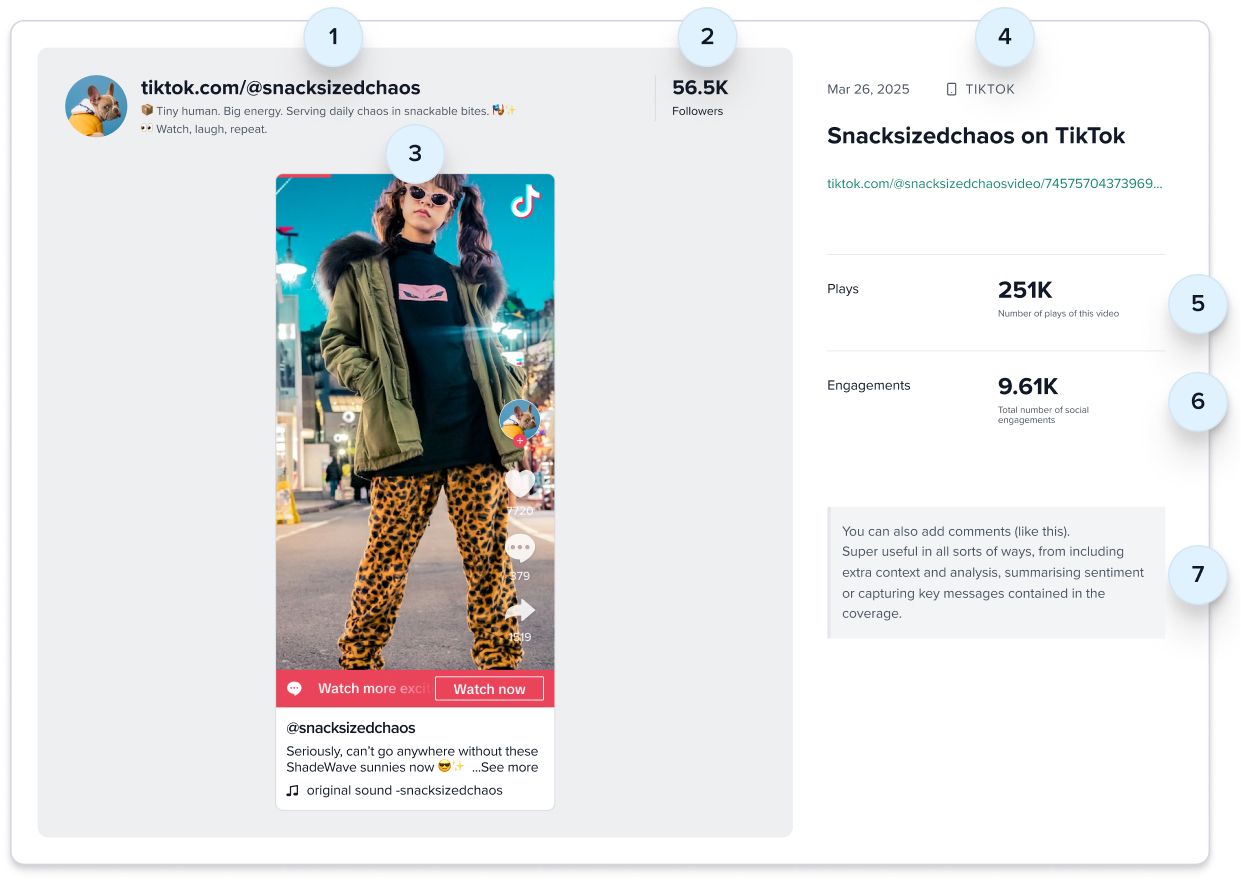
Example of TikTok coverage with post embedded and data collected

TikToks are embedded, so they can be played within your report

TikTok logo iconTikTok

Add links to TikToks to capture...

  1. Profile data: name, logo, description and Follower count

  2. Live embed: content plays within your report

  3. Coverage details: date posted, post title and Coverage Type

  4. Coverage analysis: Brand Prominence and Sentiment to capture how visible your brand was and how it was portrayed

  5. Coverage metrics: Plays and Engagements, plus any custom metrics you add

  6. PR activity: the tactic, pitch or other activity associated with the coverage

  7. Comments: add your own context and analysis

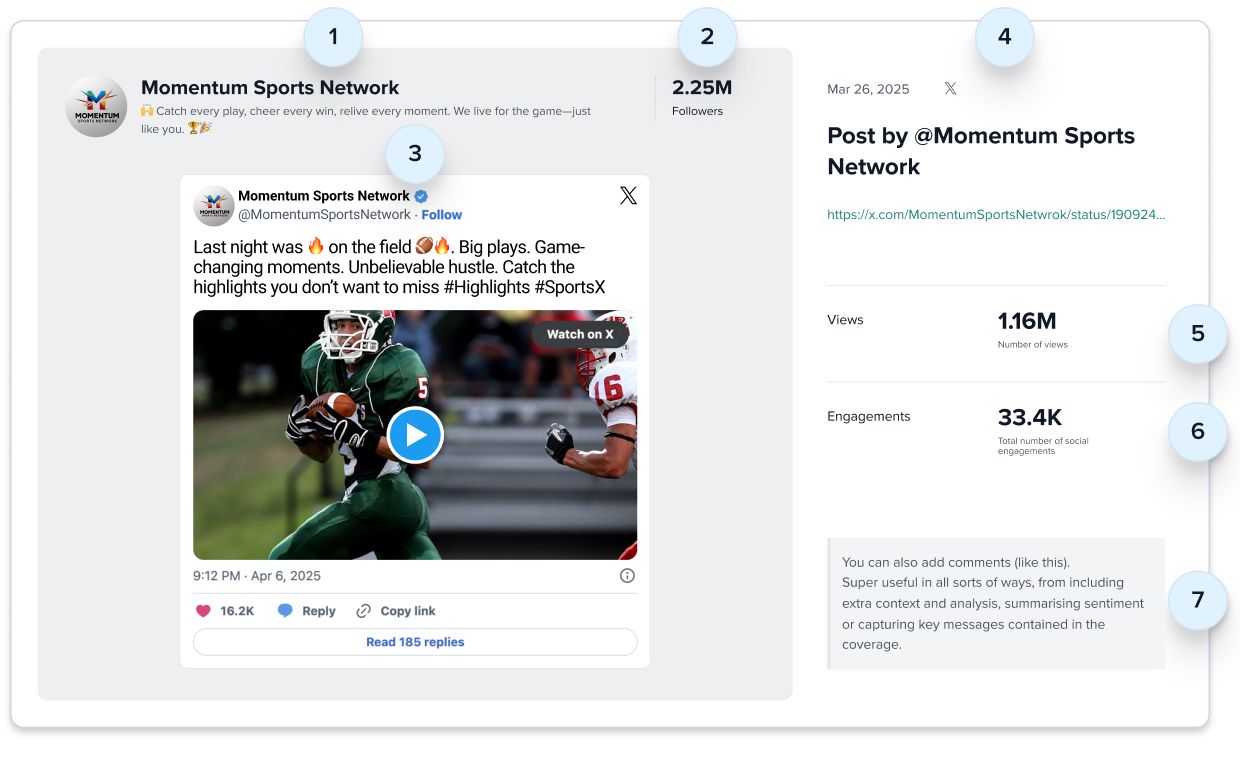
Example of X coverage with post embedded and data collected

X posts are embedded, so they can be played within your report

X logo icon

Add links to posts on X to capture...

  1. Profile data: name, logo, description and Follower count

  2. Live embed: content plays within your report

  3. Coverage details: date posted, post title and Coverage Type

  4. Coverage analysis: Brand Prominence and Sentiment to capture how visible your brand was and how it was portrayed

  5. Coverage metrics: Views and Engagements, plus any custom metrics you add

  6. PR activity: the tactic, pitch or other activity associated with the coverage

  7. Comments: add your own context and analysis

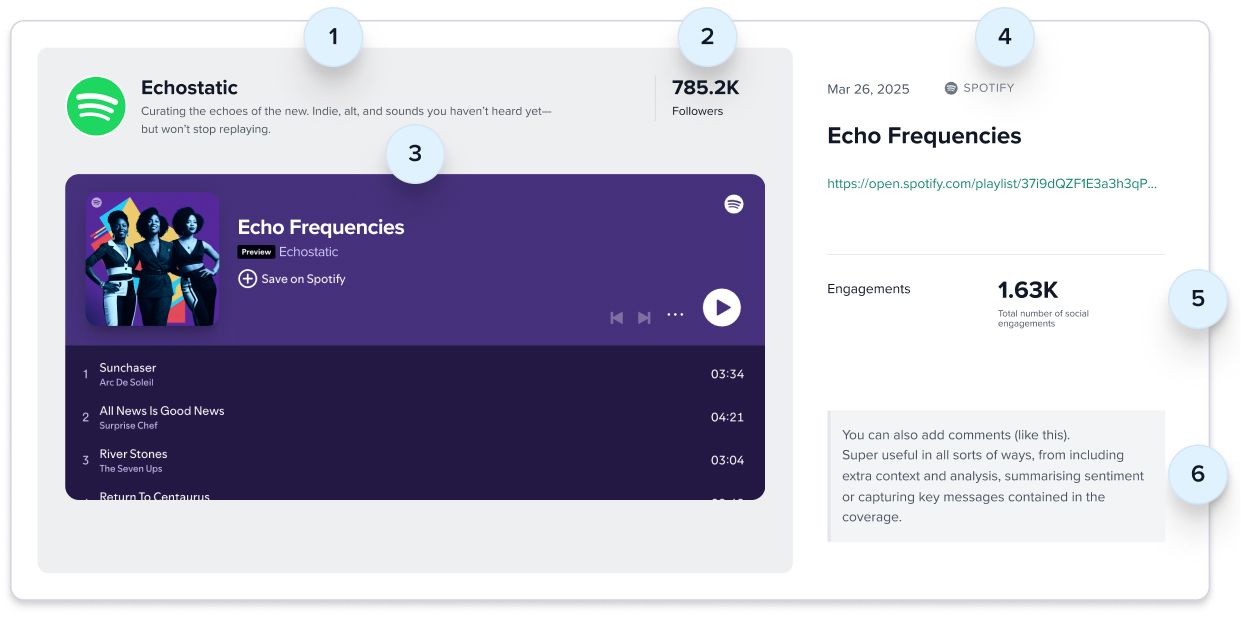
Example of Spotify coverage with playlist embedded and data collected

Spotify playlists are embedded, so they can be played within your report

Spotify logo iconSpotify

Add links to Spotify playlists to capture...

  1. Profile data: name, logo, description and Follower count

  2. Live embed: content plays within your report

  3. Coverage details: playlist title, date and Coverage Type

  4. Coverage analysis: Brand Prominence and Sentiment to capture how visible your brand was and how it was portrayed

  5. Coverage metrics: Engagements, plus any custom metrics you add

  6. PR activity: the tactic, pitch or other activity associated with the coverage

  7. Comments: add your own context and analysis

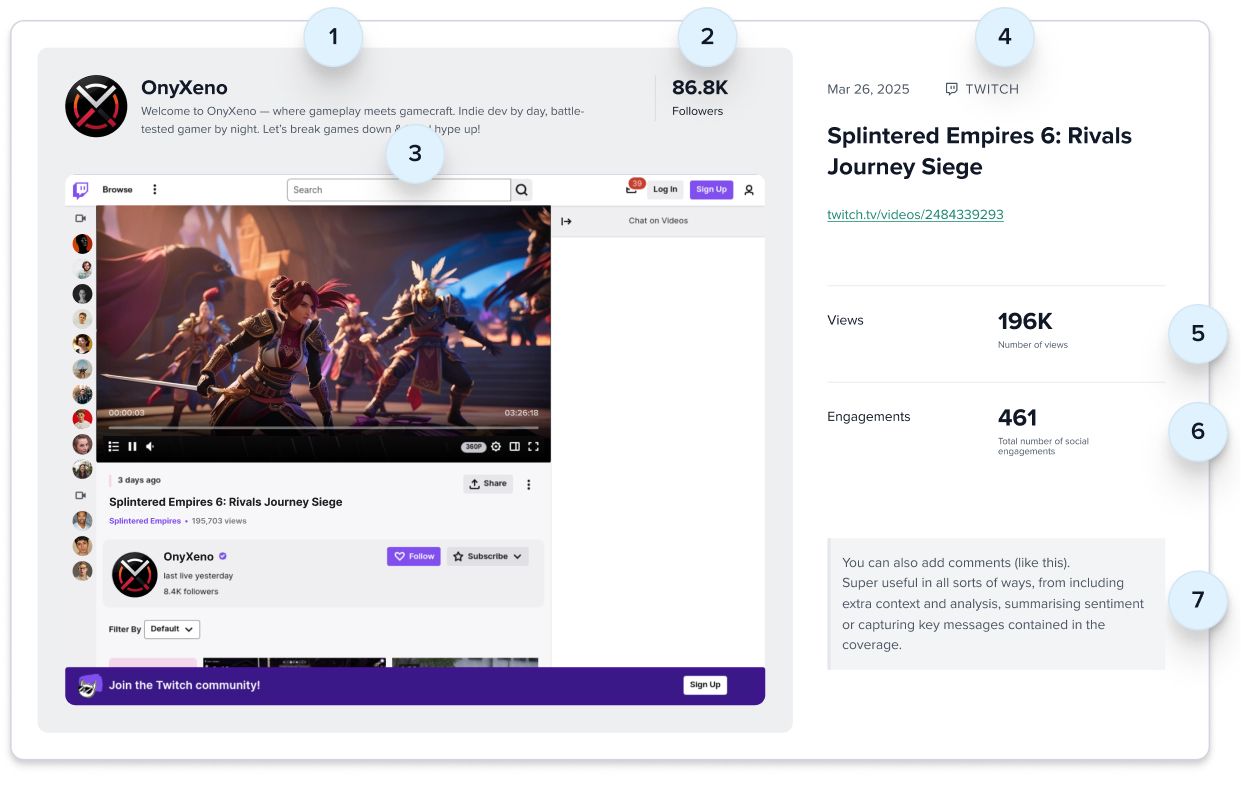
Example of Twitch coverage with screenshot and data collected

We capture screenshots of Twitch streams and clips

Twitch logo iconTwitch

Add links to Twitch streams or clips to capture...

  1. Profile data: name, logo, description and Follower count

  2. Screenshot: captures the stream or clip

  3. Coverage details: title, date and Coverage Type

  4. Coverage analysis: Brand Prominence and Sentiment to capture how visible your brand was and how it was portrayed

  5. Coverage metrics: Views and Engagements, plus any custom metrics you add

  6. PR activity: the tactic, pitch or other activity associated with the coverage

  7. Comments: add your own context and analysis

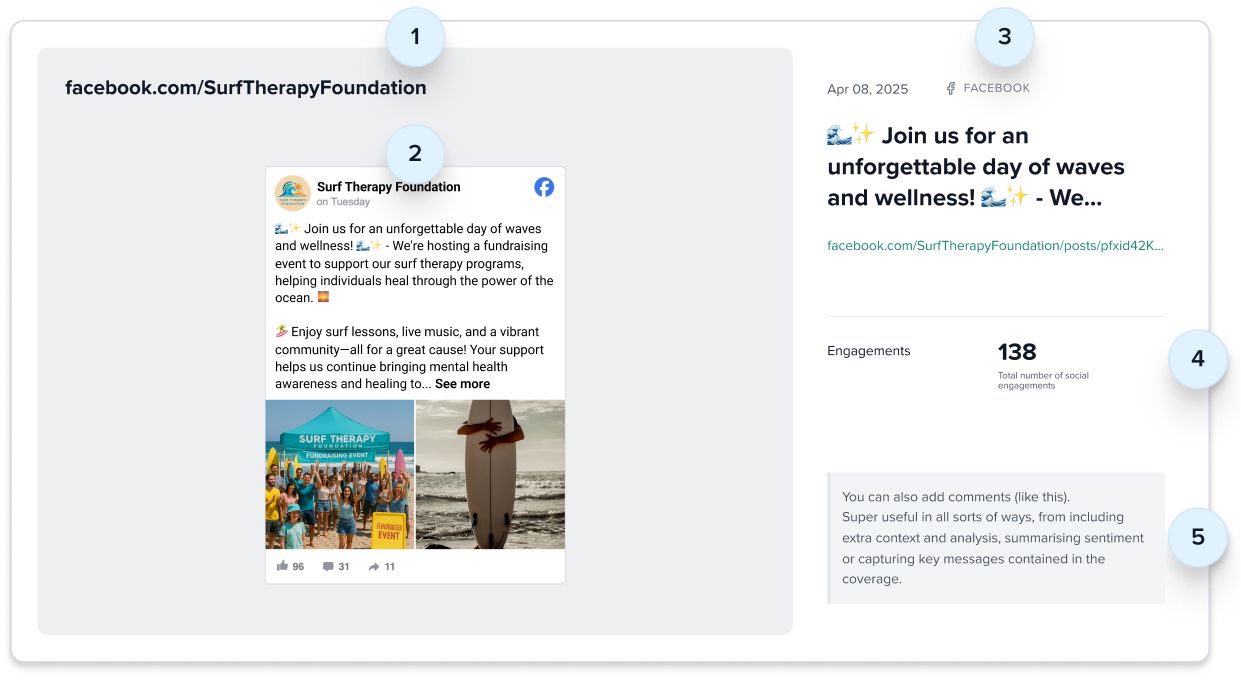
Example of Facebook coverage with embed of the post

Facebook logo iconFacebook

Add links to Facebook posts to capture...

  1. Profile data: name, logo, description and Follower count

  2. Live embed: content plays within your report

  3. Coverage details: date posted, post title and Coverage Type

  4. Coverage analysis: Brand Prominence and Sentiment to capture how visible your brand was and how it was portrayed

  5. Coverage metrics: Views and Engagements, plus any custom metrics you add

  6. PR activity: the tactic, pitch or other activity associated with the coverage

  7. Comments: add your own context and analysis

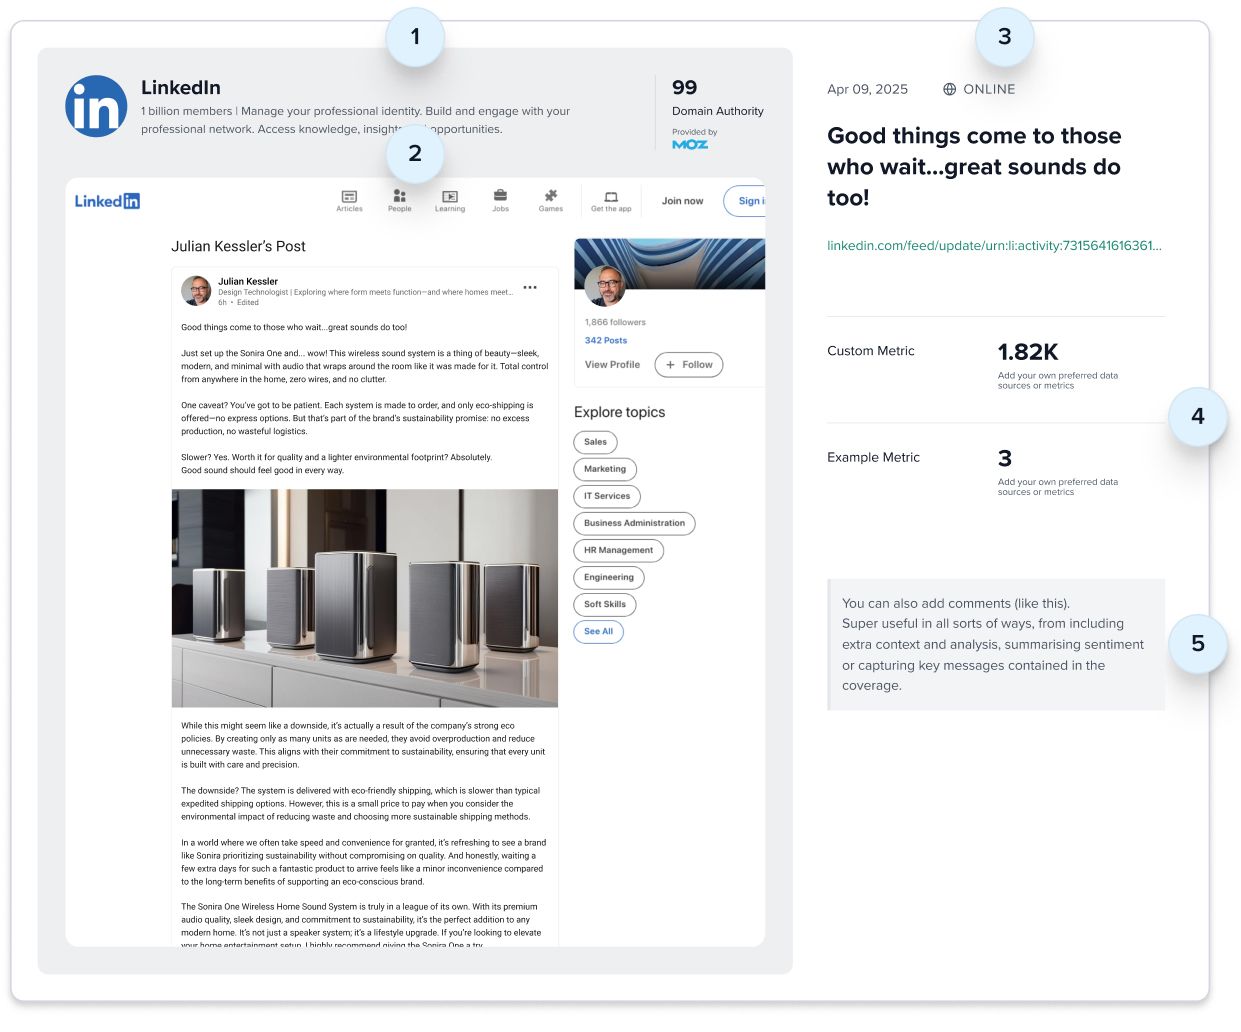
Example of LinkedIn coverage with screenshot and custom metrics added

LinkedIn logo iconLinkedIn

Add links to LinkedIn posts to capture...

  1. Profile data: name, logo, description and Follower count

  2. Screenshot: of the post

  3. Coverage details: title, date and Coverage Type

  4. Coverage analysis: Brand Prominence and Sentiment to capture how visible your brand was and how it was portrayed

  5. Coverage metrics: Engagements, plus any custom metrics you add

  6. PR activity: the tactic, pitch or other activity associated with the coverage

  7. Comments: add your own context and analysis

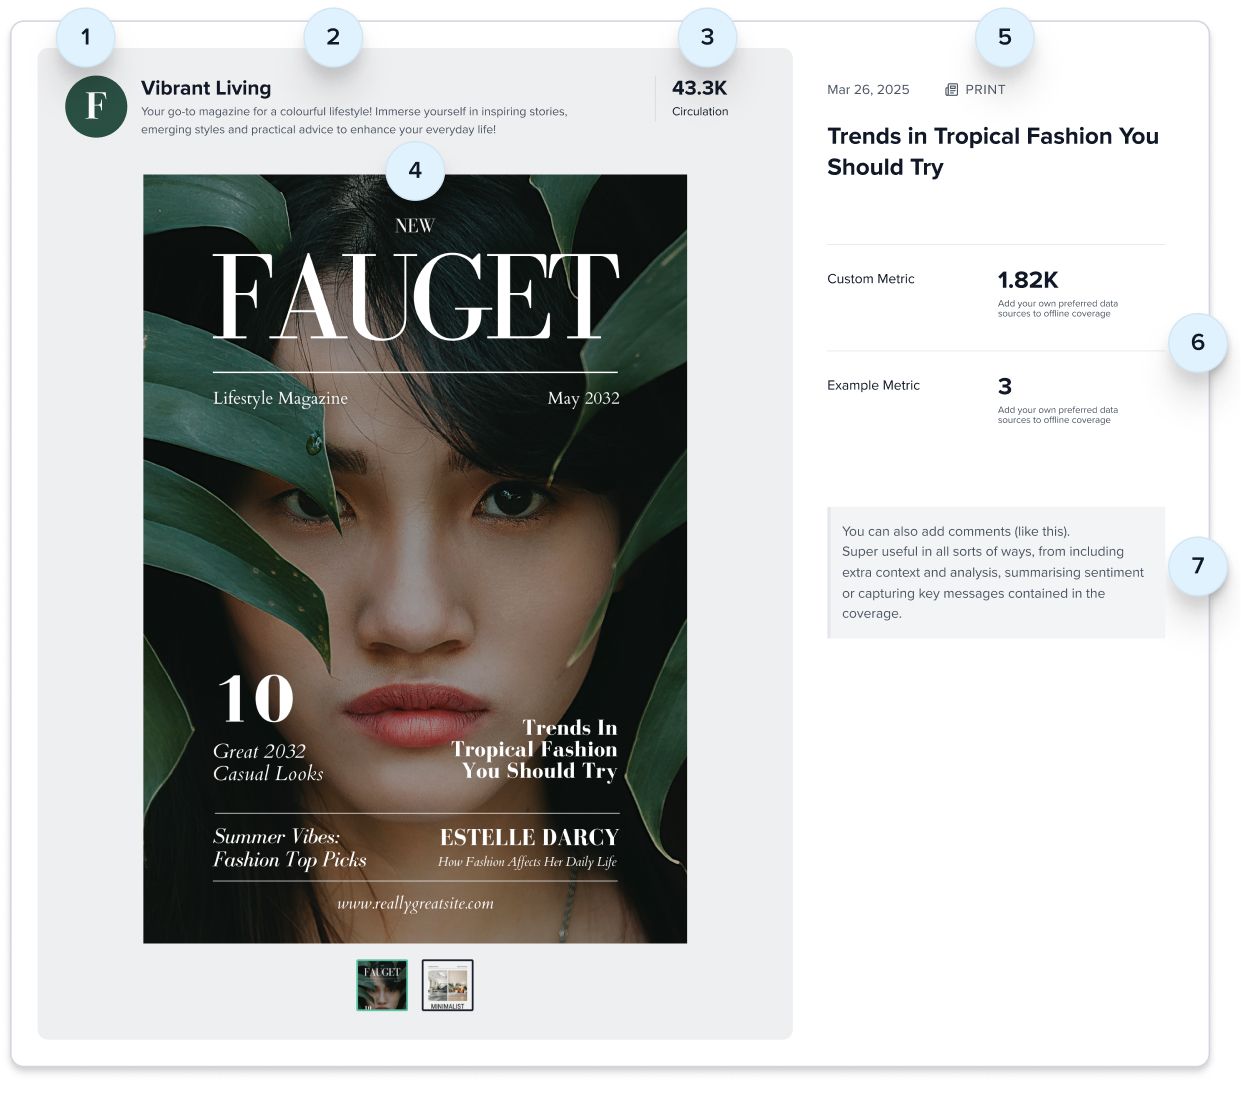
Example of print coverage with custom data added

Upload mulitple images/clippings of your print coverage

Newspaper iconPrint

Upload images or PDFs of your press clippings to capture...

  1. Outlet details: add publication name, logo, description and circulation

  2. Clipping images: upload and display multiple images or pages

  3. Coverage details: title, date and Coverage Type automatically identified from your clipping image

  4. Coverage analysis: Brand Prominence and Sentiment to capture how visible your brand was and how it was portrayed

  5. Coverage metrics: add your own custom metrics

  6. PR activity: the tactic, pitch or other activity associated with the coverage

  7. Comments: add your own context and analysis

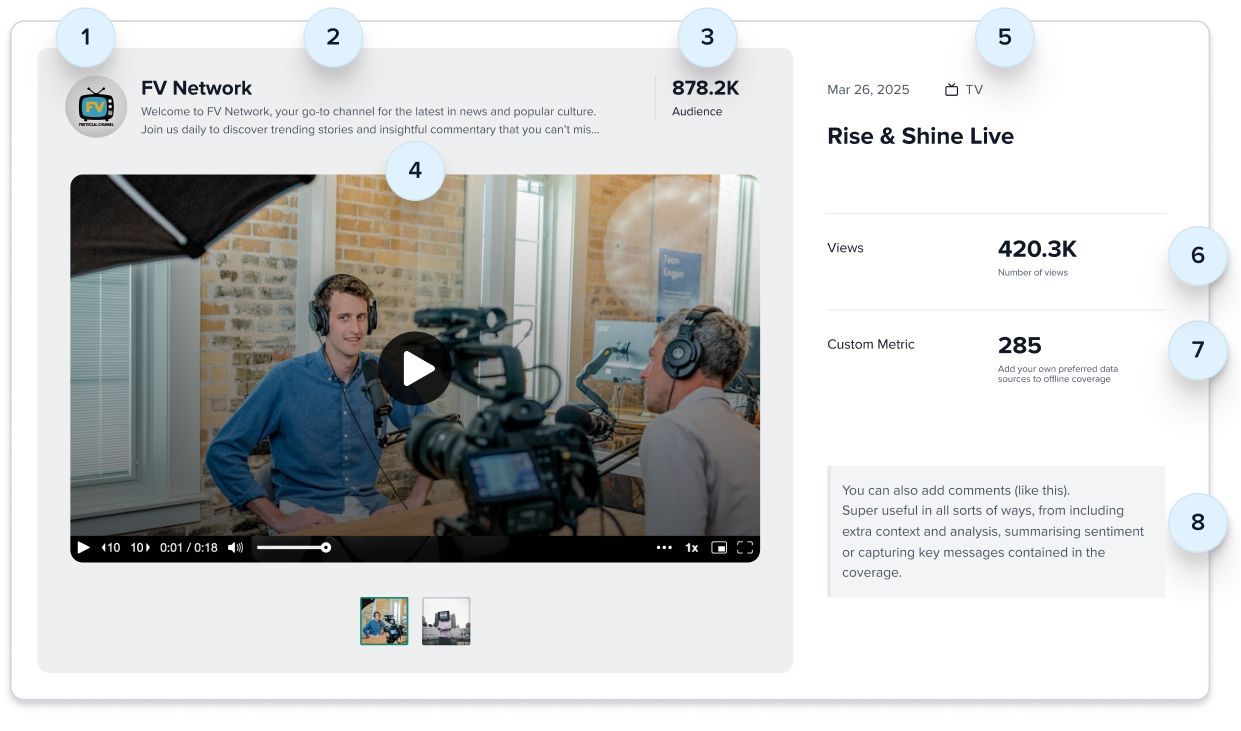
Example of TV coverage with custom data added

Video or audio clips are playable within your report

TV iconBroadcast

Upload video/audio clips or images to capture...

  1. Outlet details: add channel name, logo, description and Audience

  2. Video & audio clips: upload and play multiple files

  3. Coverage details: title, date and Coverage Type

  4. Coverage analysis: Brand Prominence and Sentiment to capture how visible your brand was and how it was portrayed

  5. Coverage metrics: add your own views numbers and custom metrics

  6. PR activity: the tactic, pitch or other activity associated with the coverage

  7. Comments: add your own context and analysis

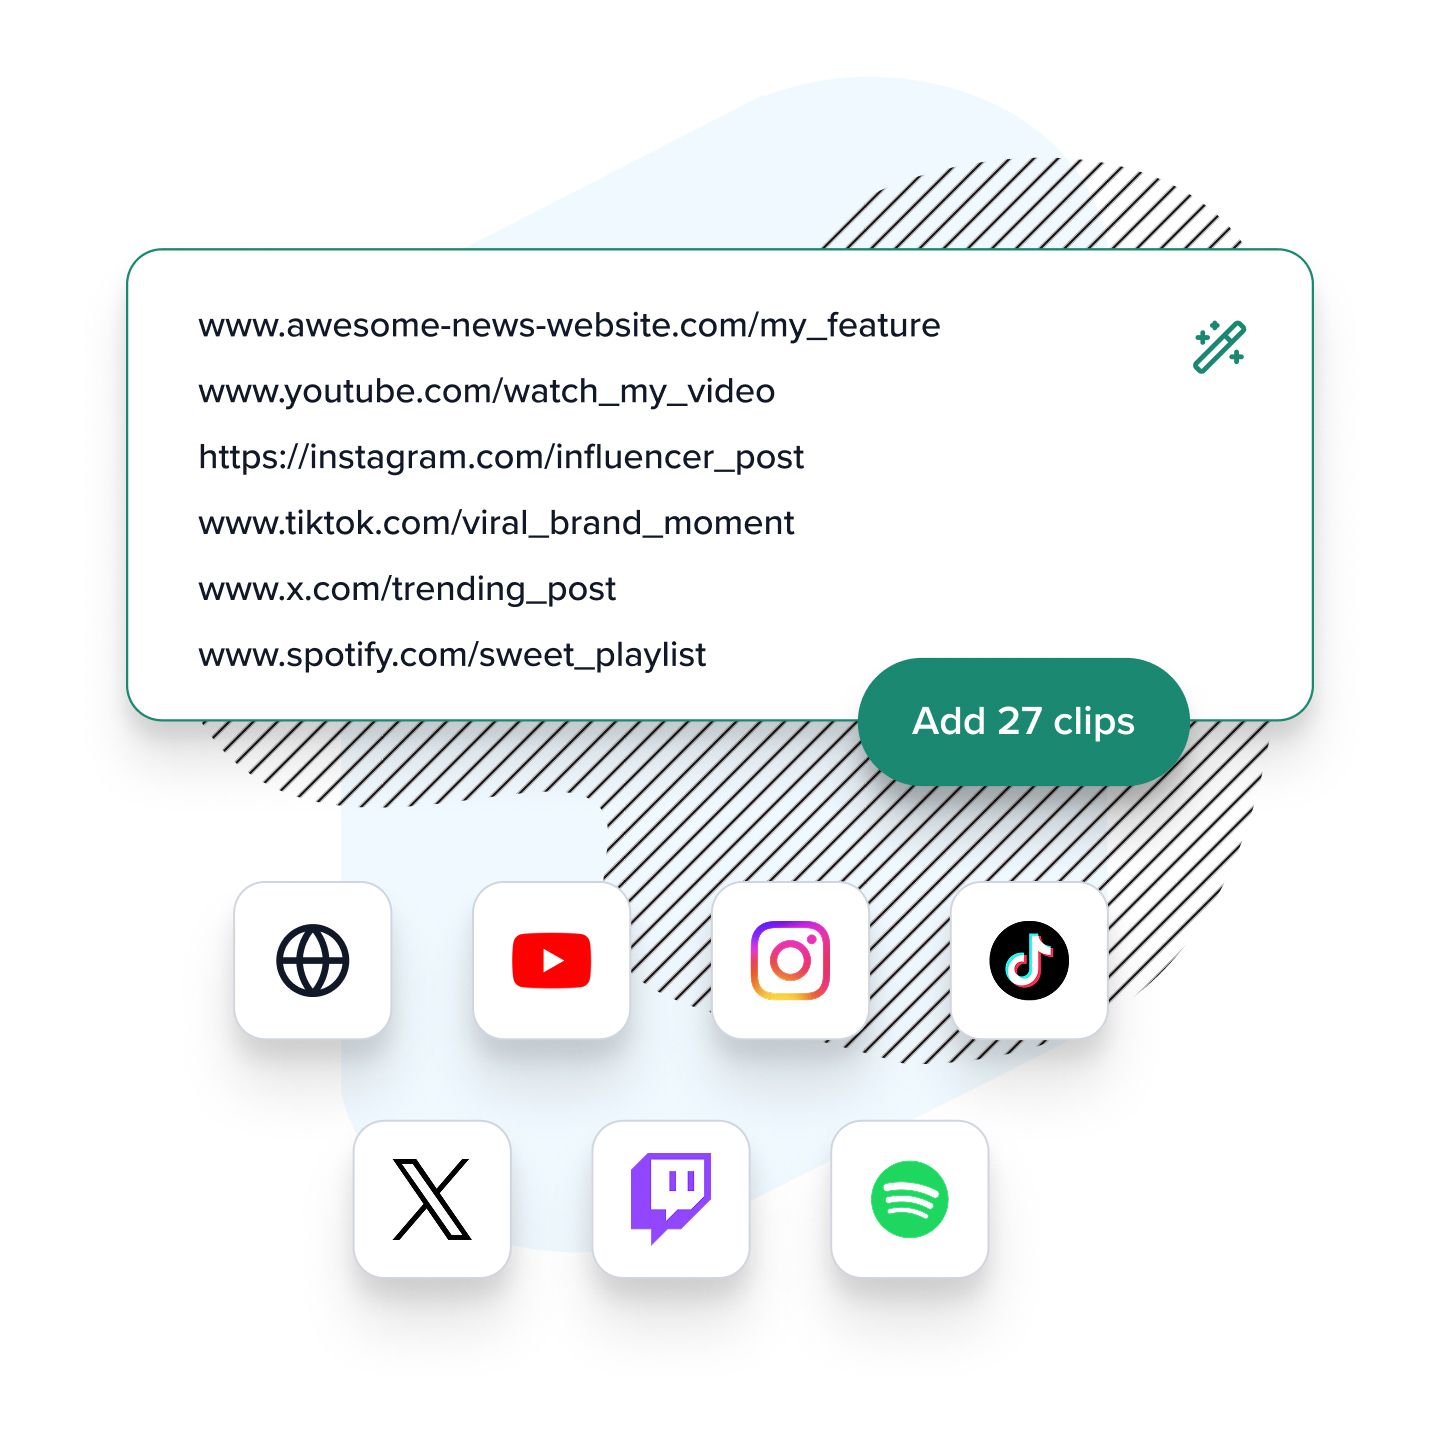
Form field with URLs from various media sources with logos for YouTube, Instagram, TikTok, X, Twitch and Spotify

Automated data & visuals for supported platforms

Simply paste in a link to your coverage—whether that’s on YouTube, Instagram, TikTok, X, Twitch, Spotify, Facebook, LinkedIn or it’s an online article on a news site—and we’ll get busy collecting powerful metrics to measure success, and imagery to represent the placement.

We also offer partial support for many more platforms and can often capture screenshots/embeds, publication dates, titles and more. See above for more details per platform...

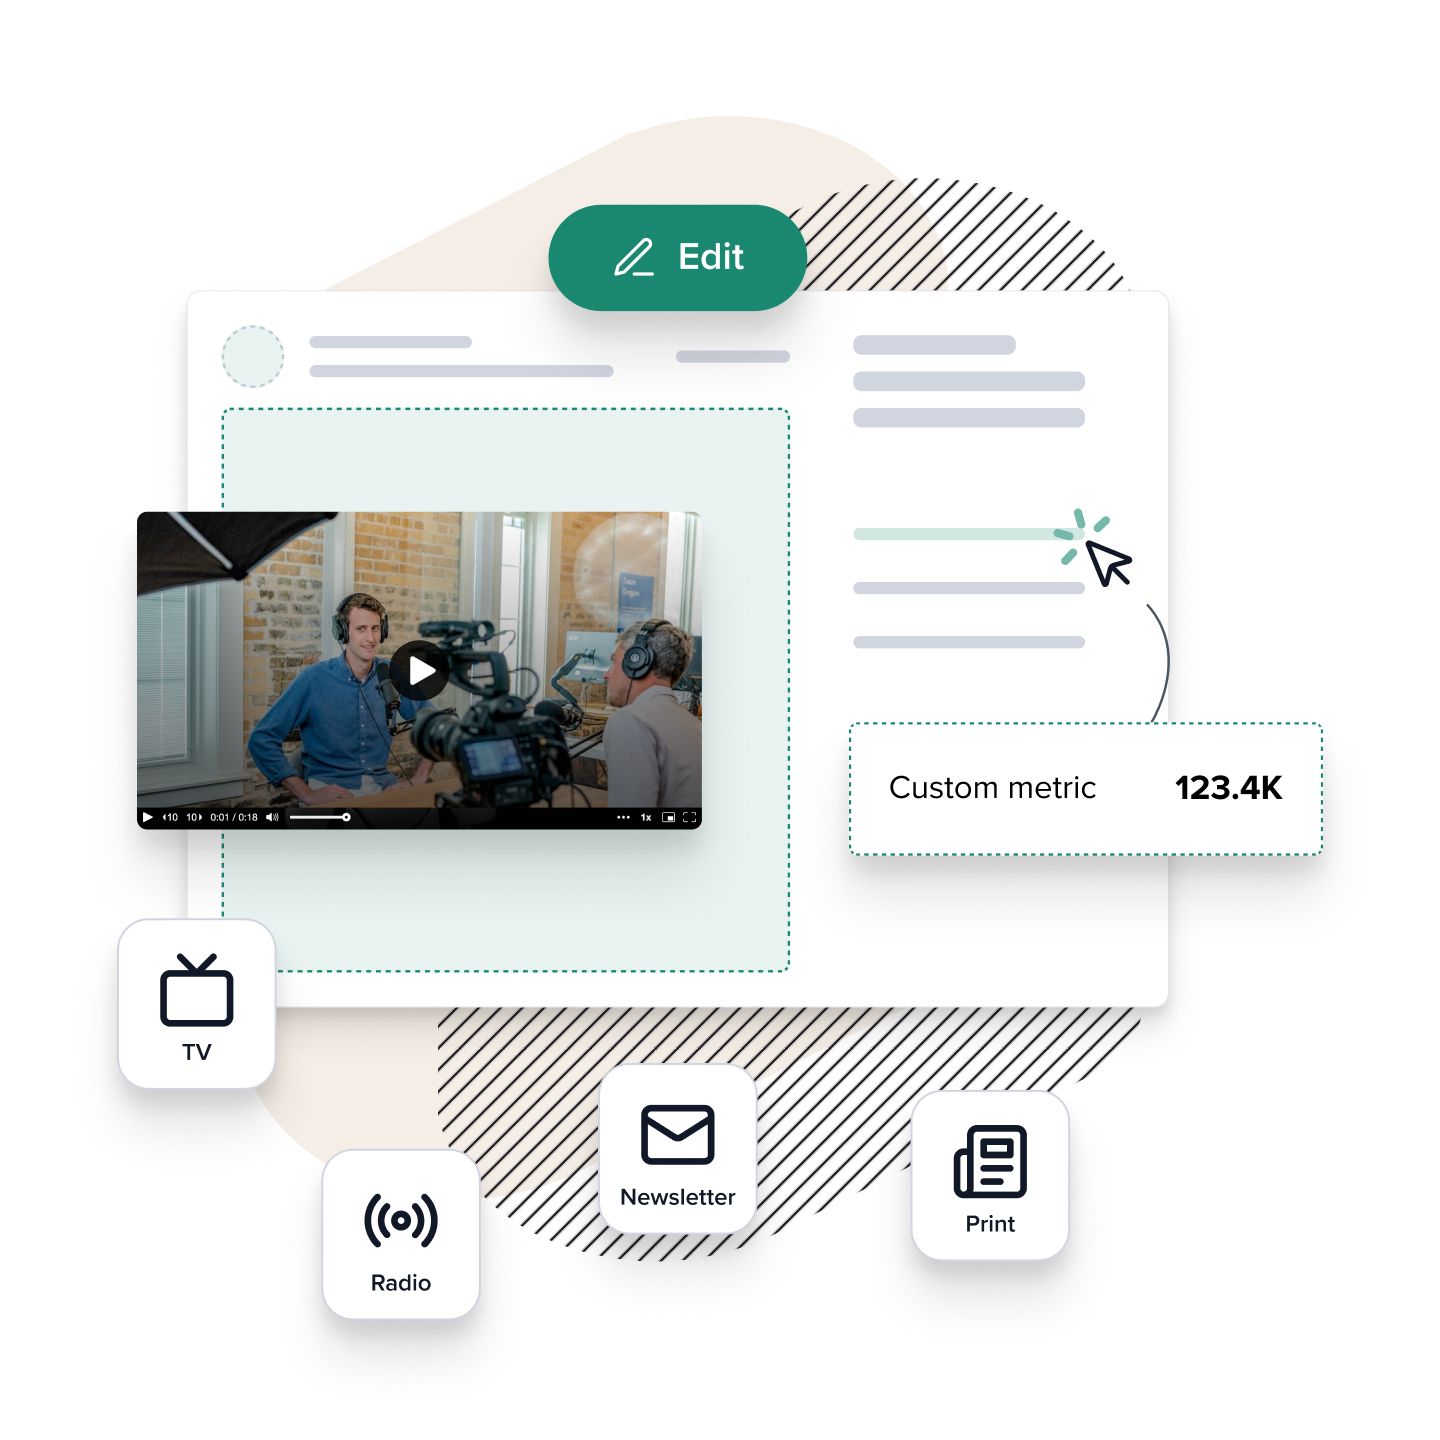
Coverage template outline with a TV clip being added and space for custom metrics

Upload images, video, audio or PDFs into our coverage template

If your coverage is offline or doesn’t have a direct link, you can still showcase your visuals & data with our customisable coverage template. Add your preferred data sources and we’ll automatically tally any metrics in your summary.

✨ When you upload print clippings, we’ll read the image and extract key details like the article title, publication date and outlet—saving you time on manual entry.

Daniel Brewer profile picture

“CoverageBook allows me to record results in an accurate, consistent and presentable fashion, providing legitimate stats at the click of a button and saving me hours each month.”

Daniel Brewer, Performance Comms

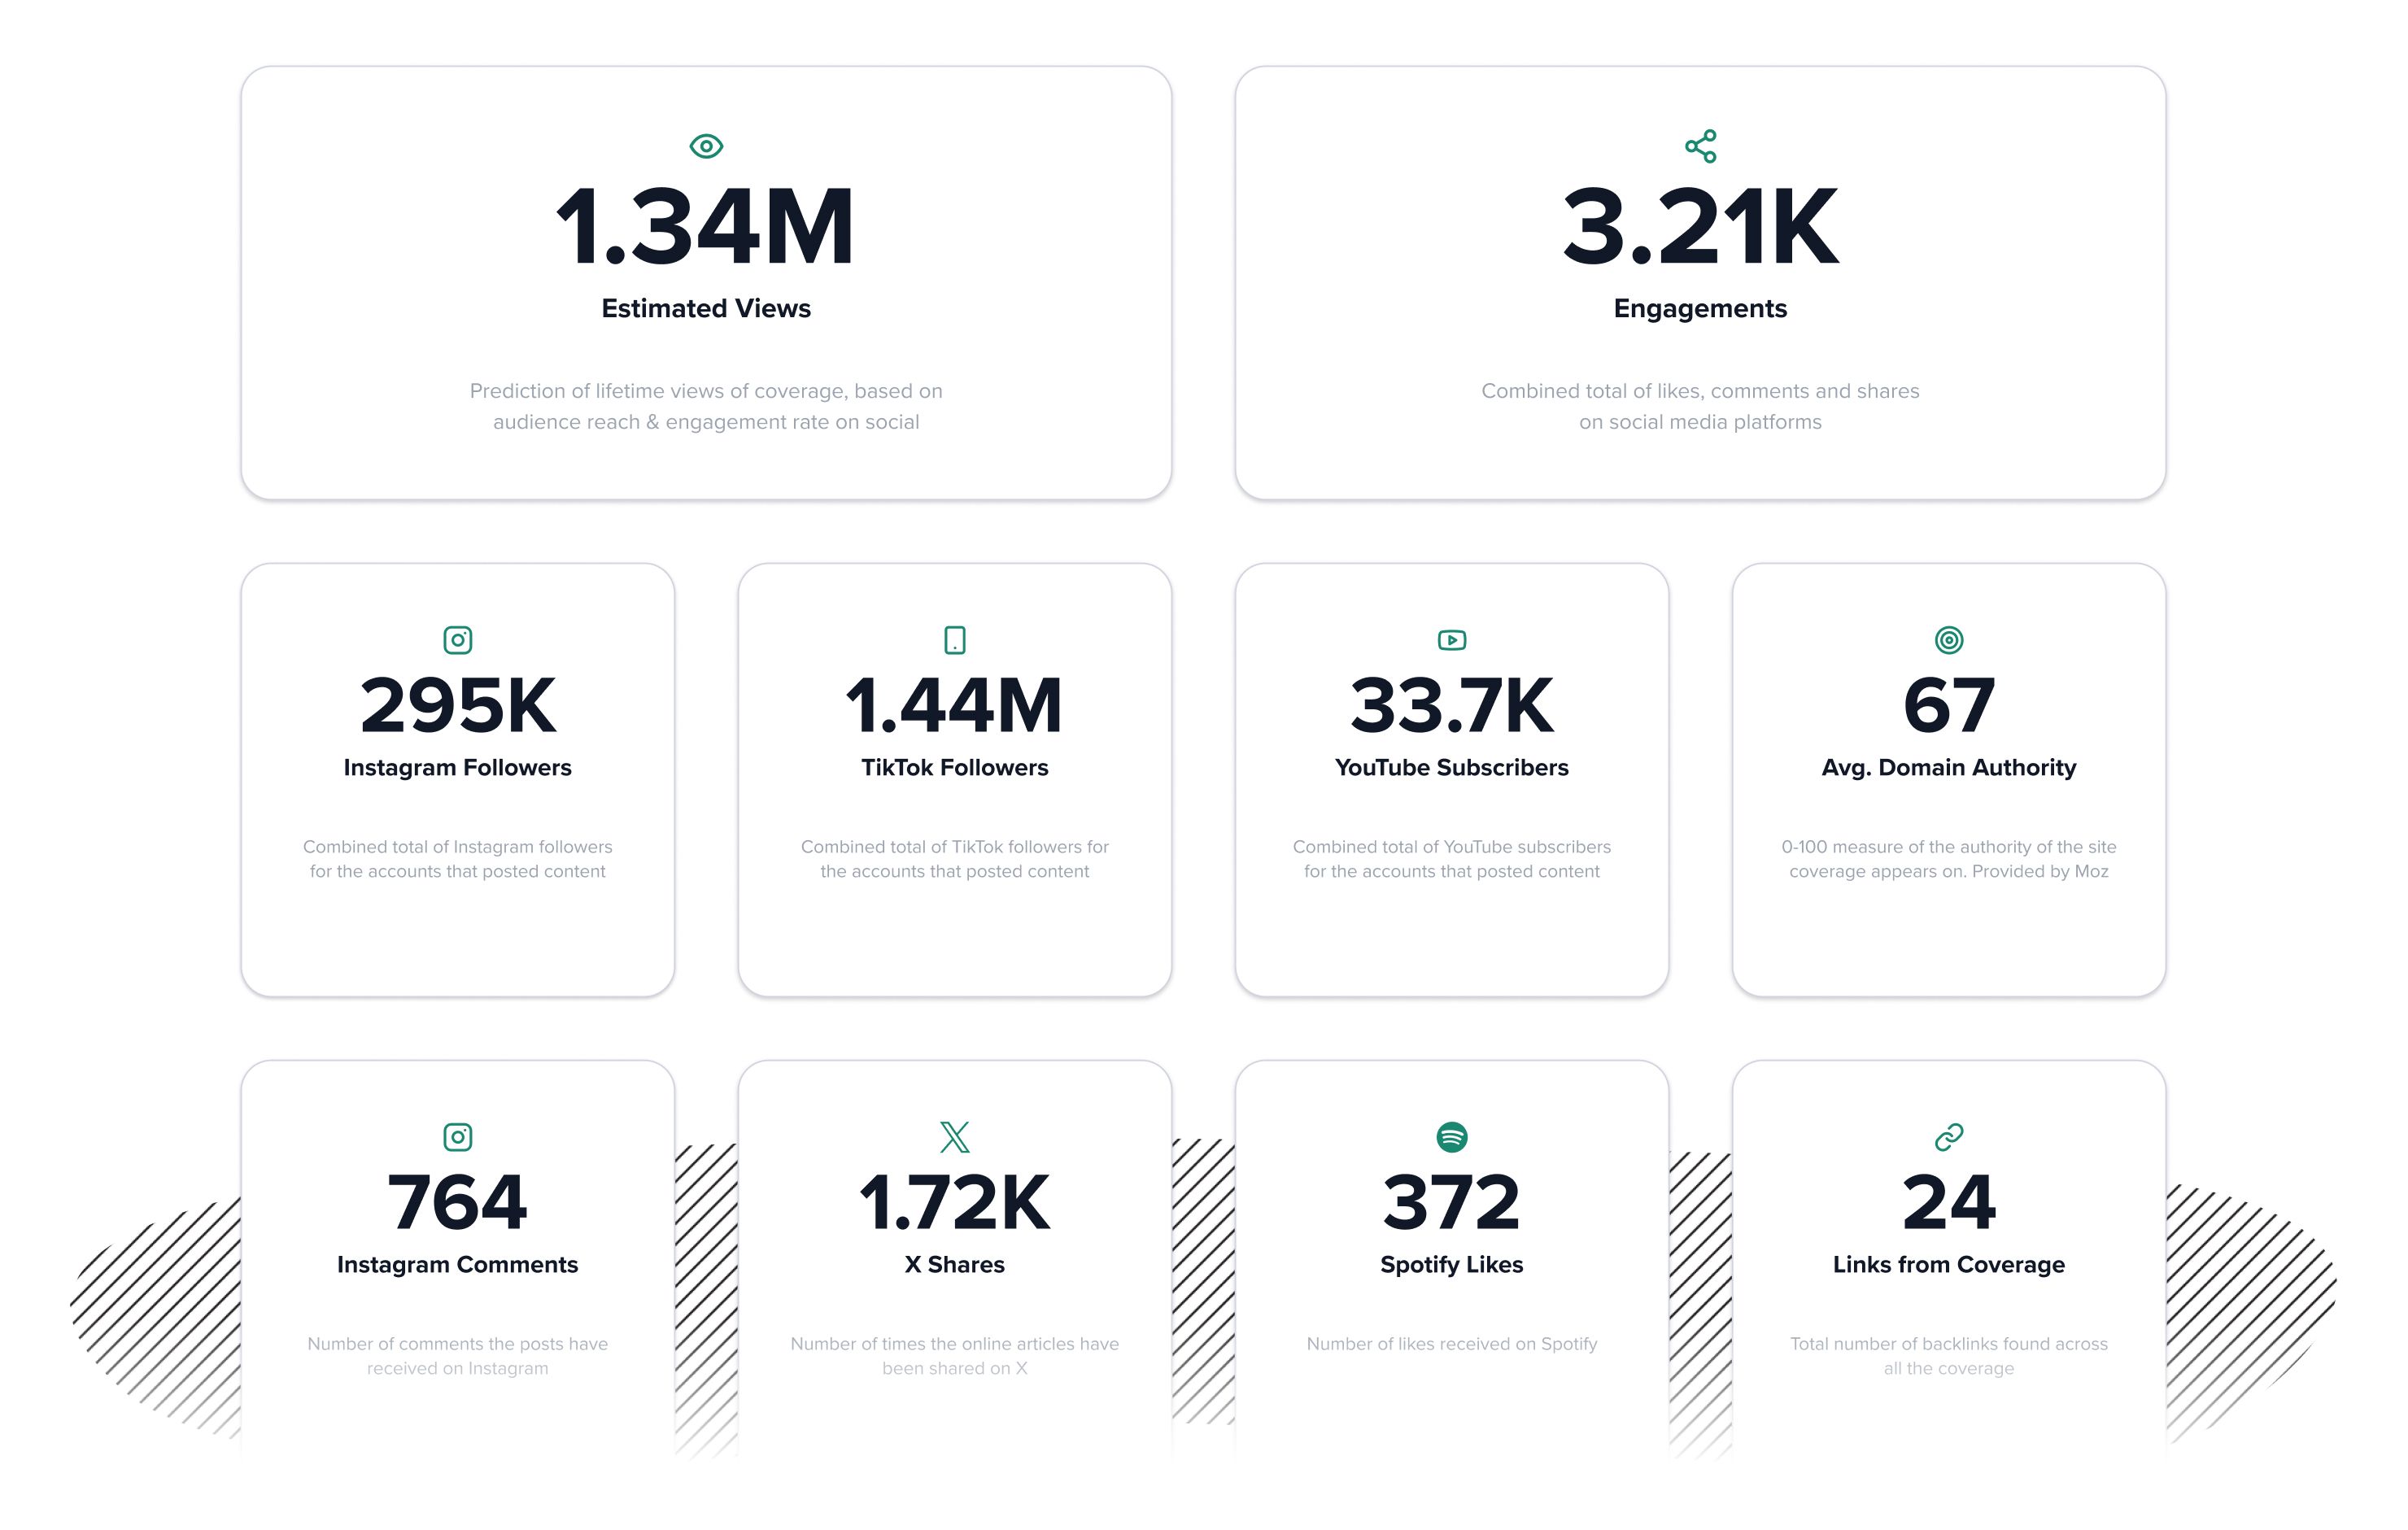
All metrics are totalled up in your customisable summary

Your valuable data isn’t just shown on individual pieces, it’s automatically tallied up for you! You control which headline stats to highlight, whether you want to showcase overall totals or break them down by platform.

Various total summary metrics for different platforms and data points
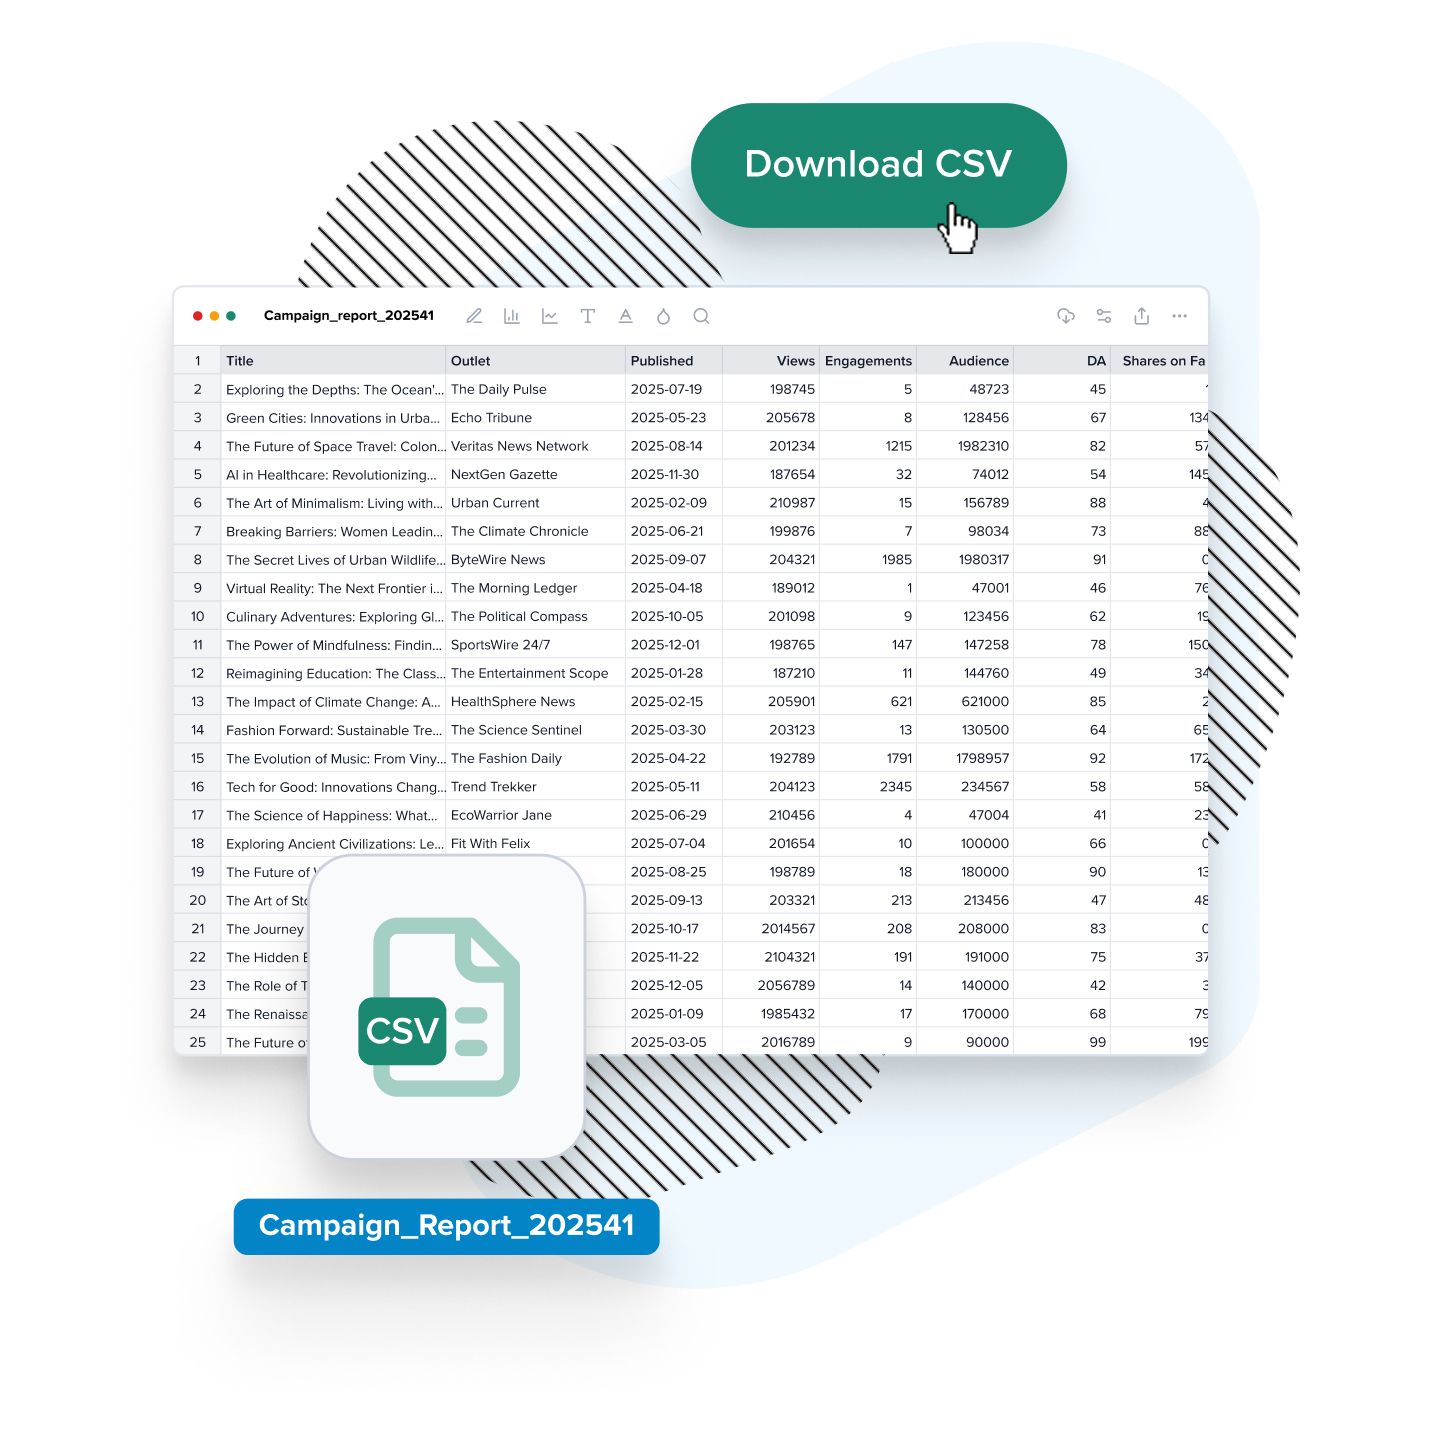
CSV file with all the data exported and displayed in a spreadsheet

Need raw data without the visuals? No problem, export the data as a CSV file

If you just want the numbers without the presentation features, it’s easy to export all your coverage metrics as a CSV file for deeper analysis or custom reporting. Perfect for teams who prefer working with spreadsheets or integrating data into other tools—no templates, just the numbers you need.

Emily Barnes profile picture

“CoverageBook is one of our agency’s most used tools. It saves us so much time in demonstrating ROI for our clients by putting together something that looks great, can be shared instantly and offers metrics that others can’t. We couldn’t live without it!”

Emily Barnes, Account Director, Fanclub PR

Trusted by over 18,753 agency and in-house public relations professionals in more than 40 countries
Customer Logos

Try CoverageBook today and showcase your coverage like a pro

With powerful automated data gathering, and the flexibility to feature all types of content. Start a free trial and see how it all works with your own coverage.

30 day free trial, no commitment, no credit card required.
Annoying Salesperson will NOT call.

Male PR Pro looking proud. Logos of social media platforms.

Questions

We certainly do, you can learn more about our 1st-class customer support here. All customer support is free. Our Enterprise plan also gives customers access to a dedicated Account Manager.
No. We have intentionally built the tool to not do this. We want you to be able to handpick your coverage and then compile a report based on that. Too many fully automated monitoring + dashboard solutions pickup irrelevant mentions. Or miss things entirely. Creating metrics + graphs people don’t end up trusting.

There is a reason most monitoring tool users end up collating a clean list of actual coverage in a spreadsheet! We are the alternative to that tracker spreadsheet. And then some...
We have lots of customers that just don’t need a fully fledged media monitoring tool. Many bookmark the URLs of their mentions as they discover them via Google news, AI agents (Gemini, Claude or OpenAI) or from the person that wrote about them. Then they paste those links into CoverageBook. And are ready to measure & showcase their work back to clients.

On the other end of the scale we have huge teams that need a solution to consolidate all the mentions they collect across multiple tools. They find consolidating a clean list of Coverage in our tool gives them the data consistency they crave!
We’ve automated the collection of coverage data since 2014. We’re getting good at it. We have picked some of the best 3rd party suppliers of key metrics such as SimilarWeb (for outlet audience data), Moz for their Domain Authority metric, Buzzsumo for social share data (which they source from X API).
Yes. You are able to add this type of coverage. We don’t auto source metrics yet, but you can add custom metrics to these items manually. When you upload print clippings, we’ll read the image and extract key details like the article title, publication date and outlet—saving you time on manual entry.
No. I know this may be a deal breaker for you. But seriously. It’s time to move on. Let us help you.
No. We do so much more. From a URL we’ll capture full screen grabs of the page, the title of the article, and the date it was published. And then pull it all together into a report ready to share. Or you can just export the data to use however you wish.
We help structure your reports and data consistently, allowing for easier analysis. By humans, of course, but increasingly by fancy-pants AI-powered models and agents. We believe to fully leverage AI now and in the future, you will need a good, clean source of coverage data that your teams find easy to add to. Your source of truth. That's where CoverageBook excels. Reports can be easily shared with AI models and agents for evaluation, analysis and insights. The challenge with fully integrated media monitoring + reporting tools is that a lot of irrelevant junk gets picked up. Junk in = junk out. This is why our customers enjoy the hand-curated nature of CoverageBook. Of course, over time, we'll start to add smart AI features too. But for now, many customers enjoy the power of automation (and the fee time that saves) we already provide. The way we take simple URLs, aggregate data, and then design reports for you ready to use already feels like magic! Give it a try and see for yourself.
Still have questions?

Get in touch, we'll be happy to help