Metrics & Data
Realistic, industry-leading metrics you don’t need a data-science degree to understand. You’re in control of what data to show and what’s most important.
Start your free trial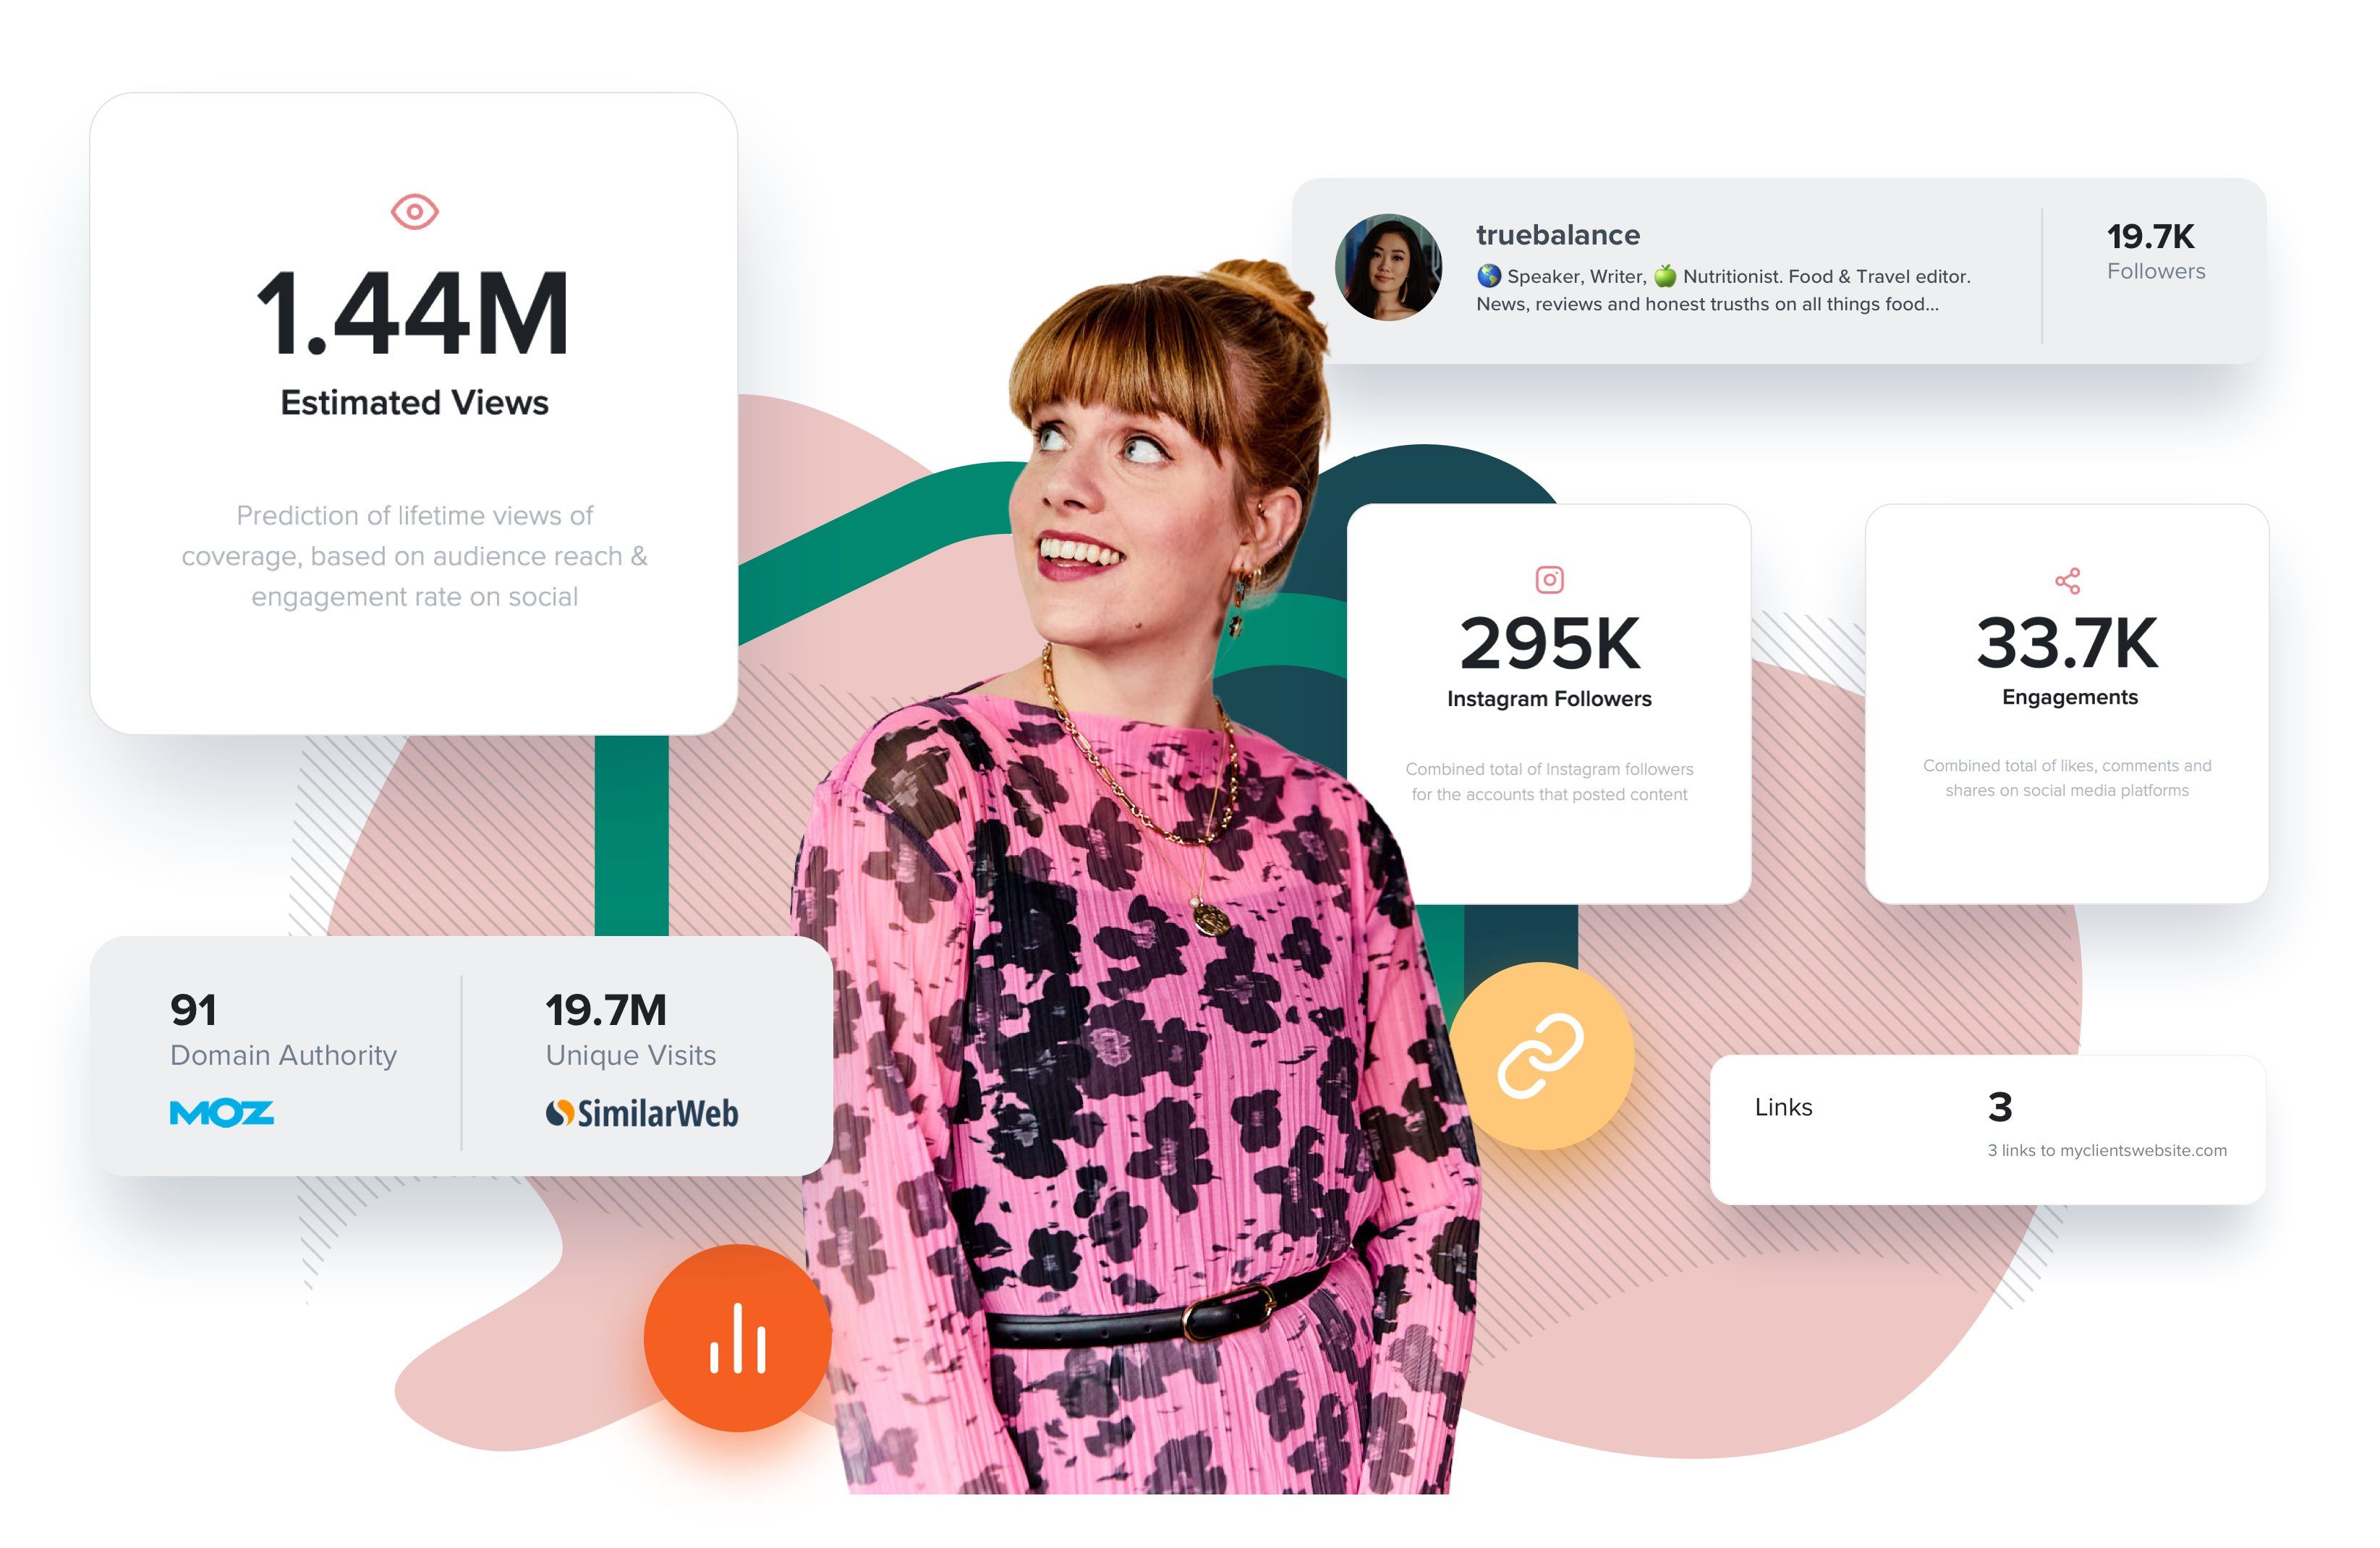
Realistic, industry-leading metrics you don’t need a data-science degree to understand. You’re in control of what data to show and what’s most important.
Start your free trial

“CoverageBook allows me to record results in an accurate, consistent and presentable fashion, providing legitimate stats at the click of a button and saving me hours each month.”
Daniel Brewer, Performance Comms
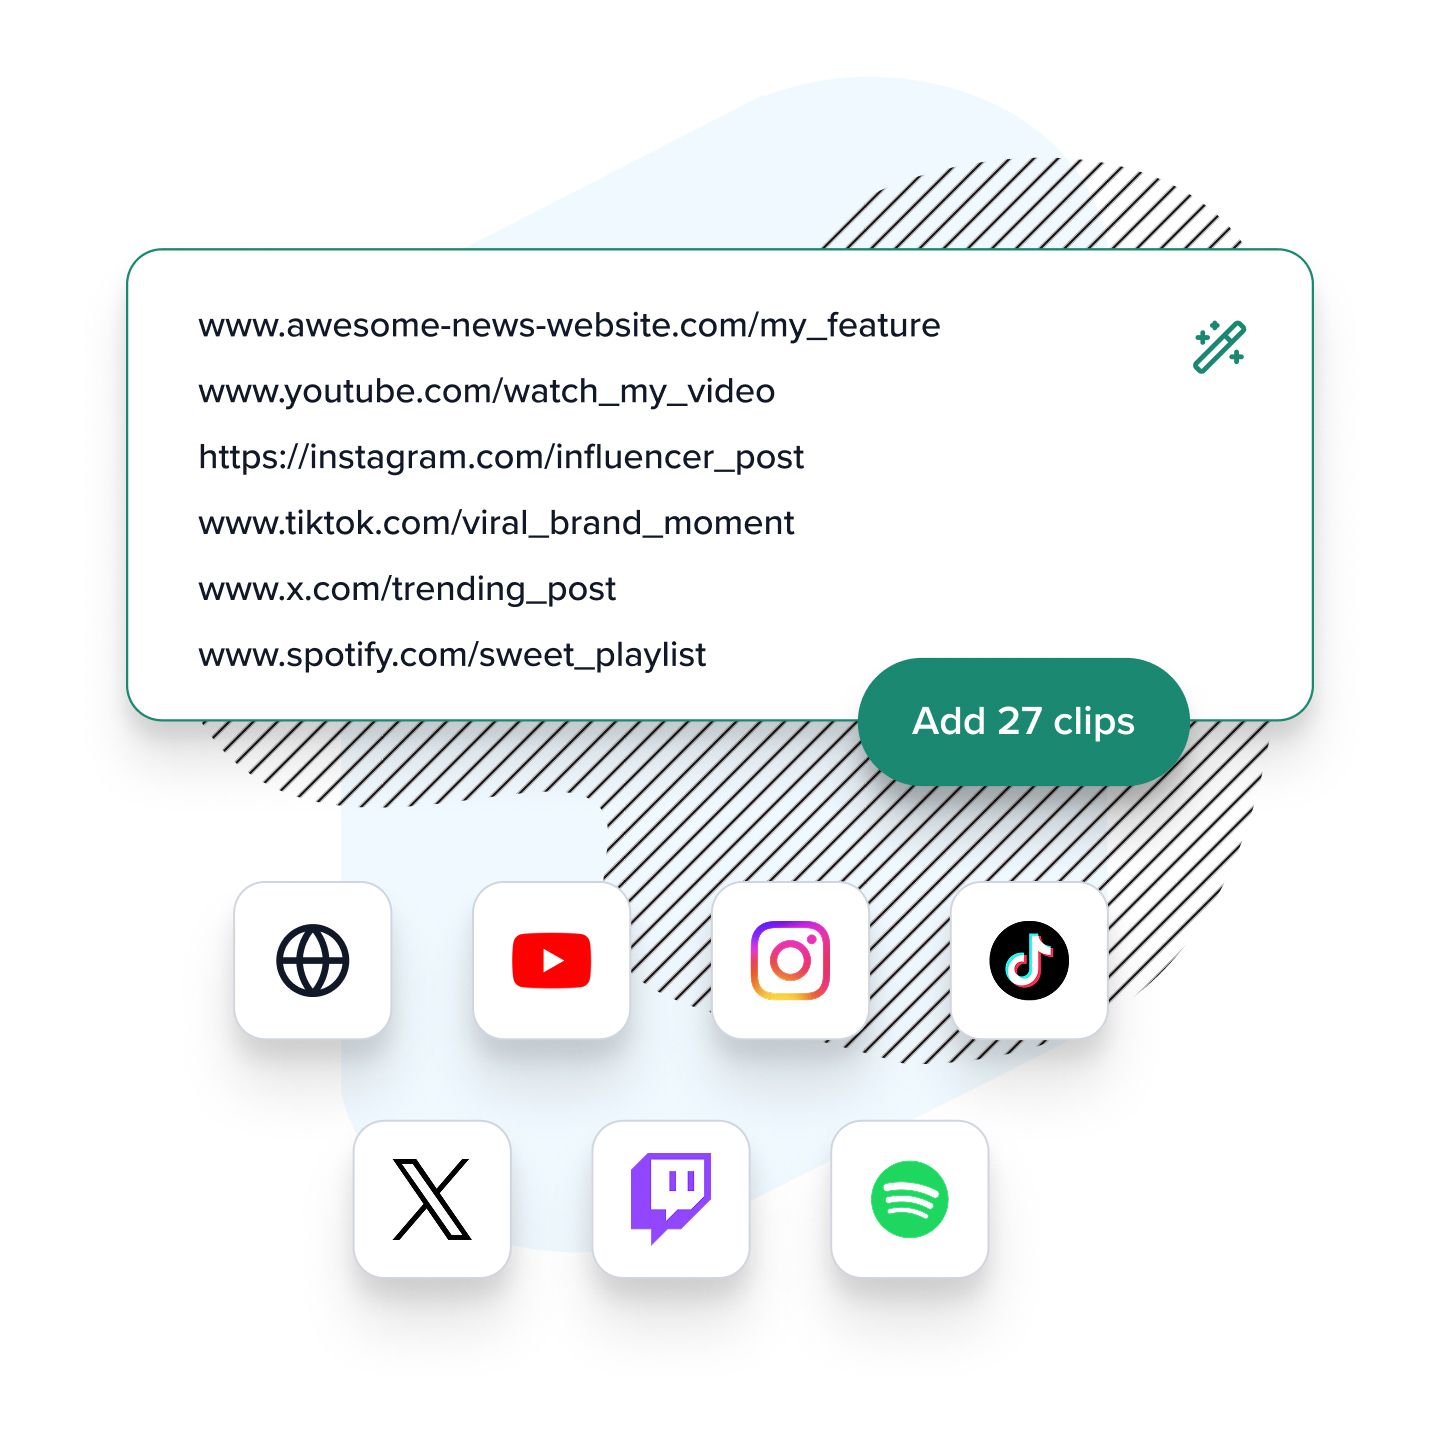
Simply paste in a link to your coverage—whether that’s on YouTube, Instagram, TikTok, X, Twitch, Spotify, Facebook, LinkedIn or it’s an online article on a news site—and we’ll get busy collecting powerful metrics to measure success, and imagery to represent the placement.
And for other media types like print and broadcast you can still use our slick coverage template to ensure all your media hits look professional, consistent and equally impressive. See exactly how it looks for different coverage types
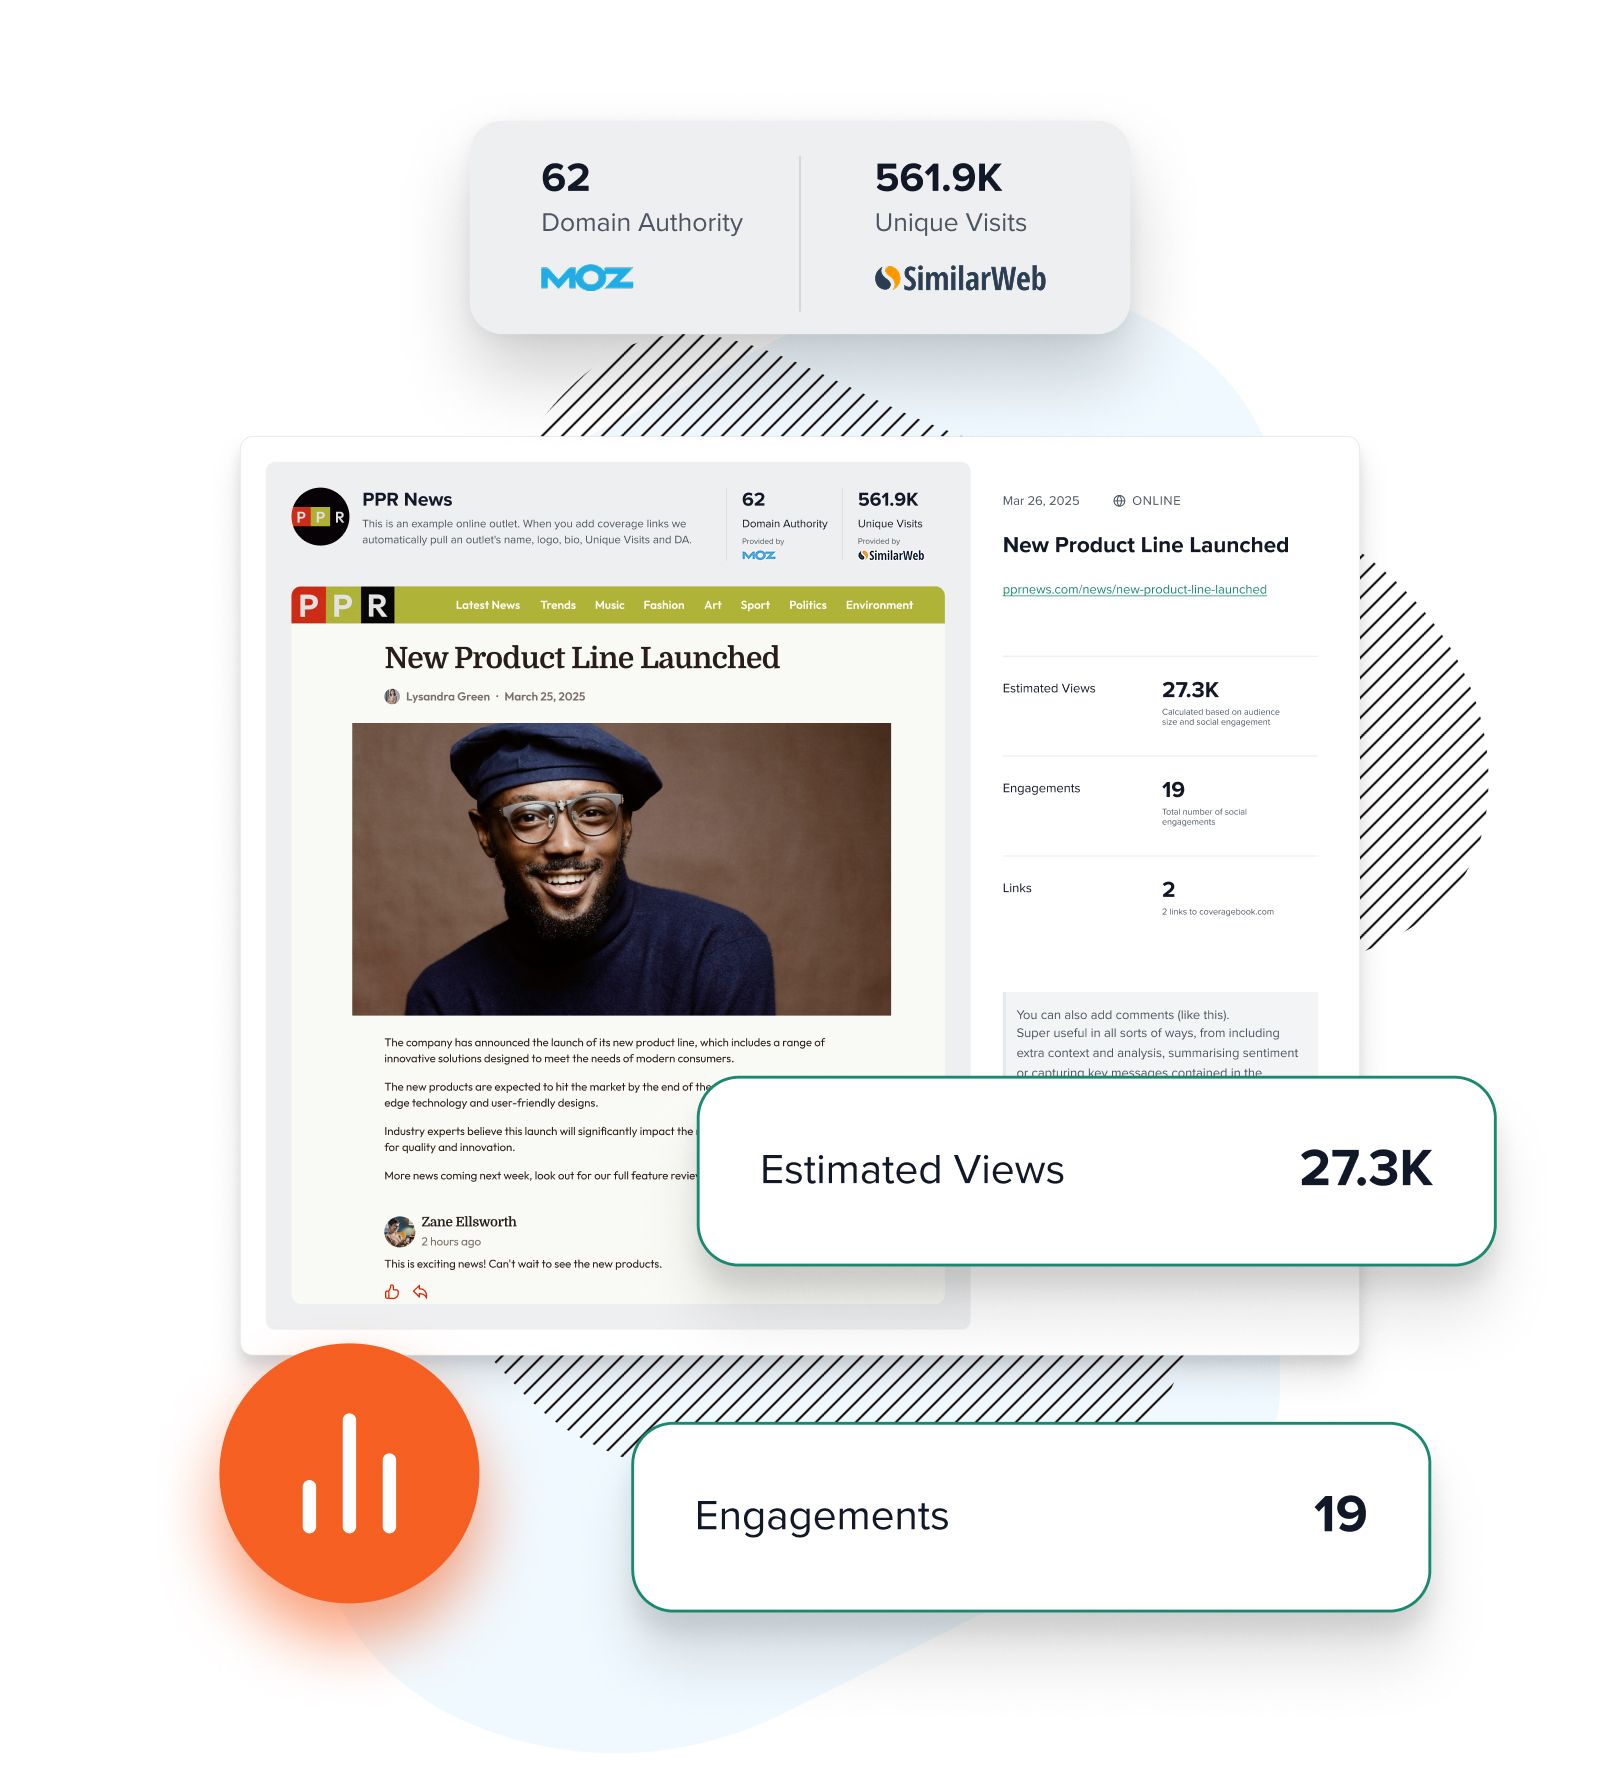
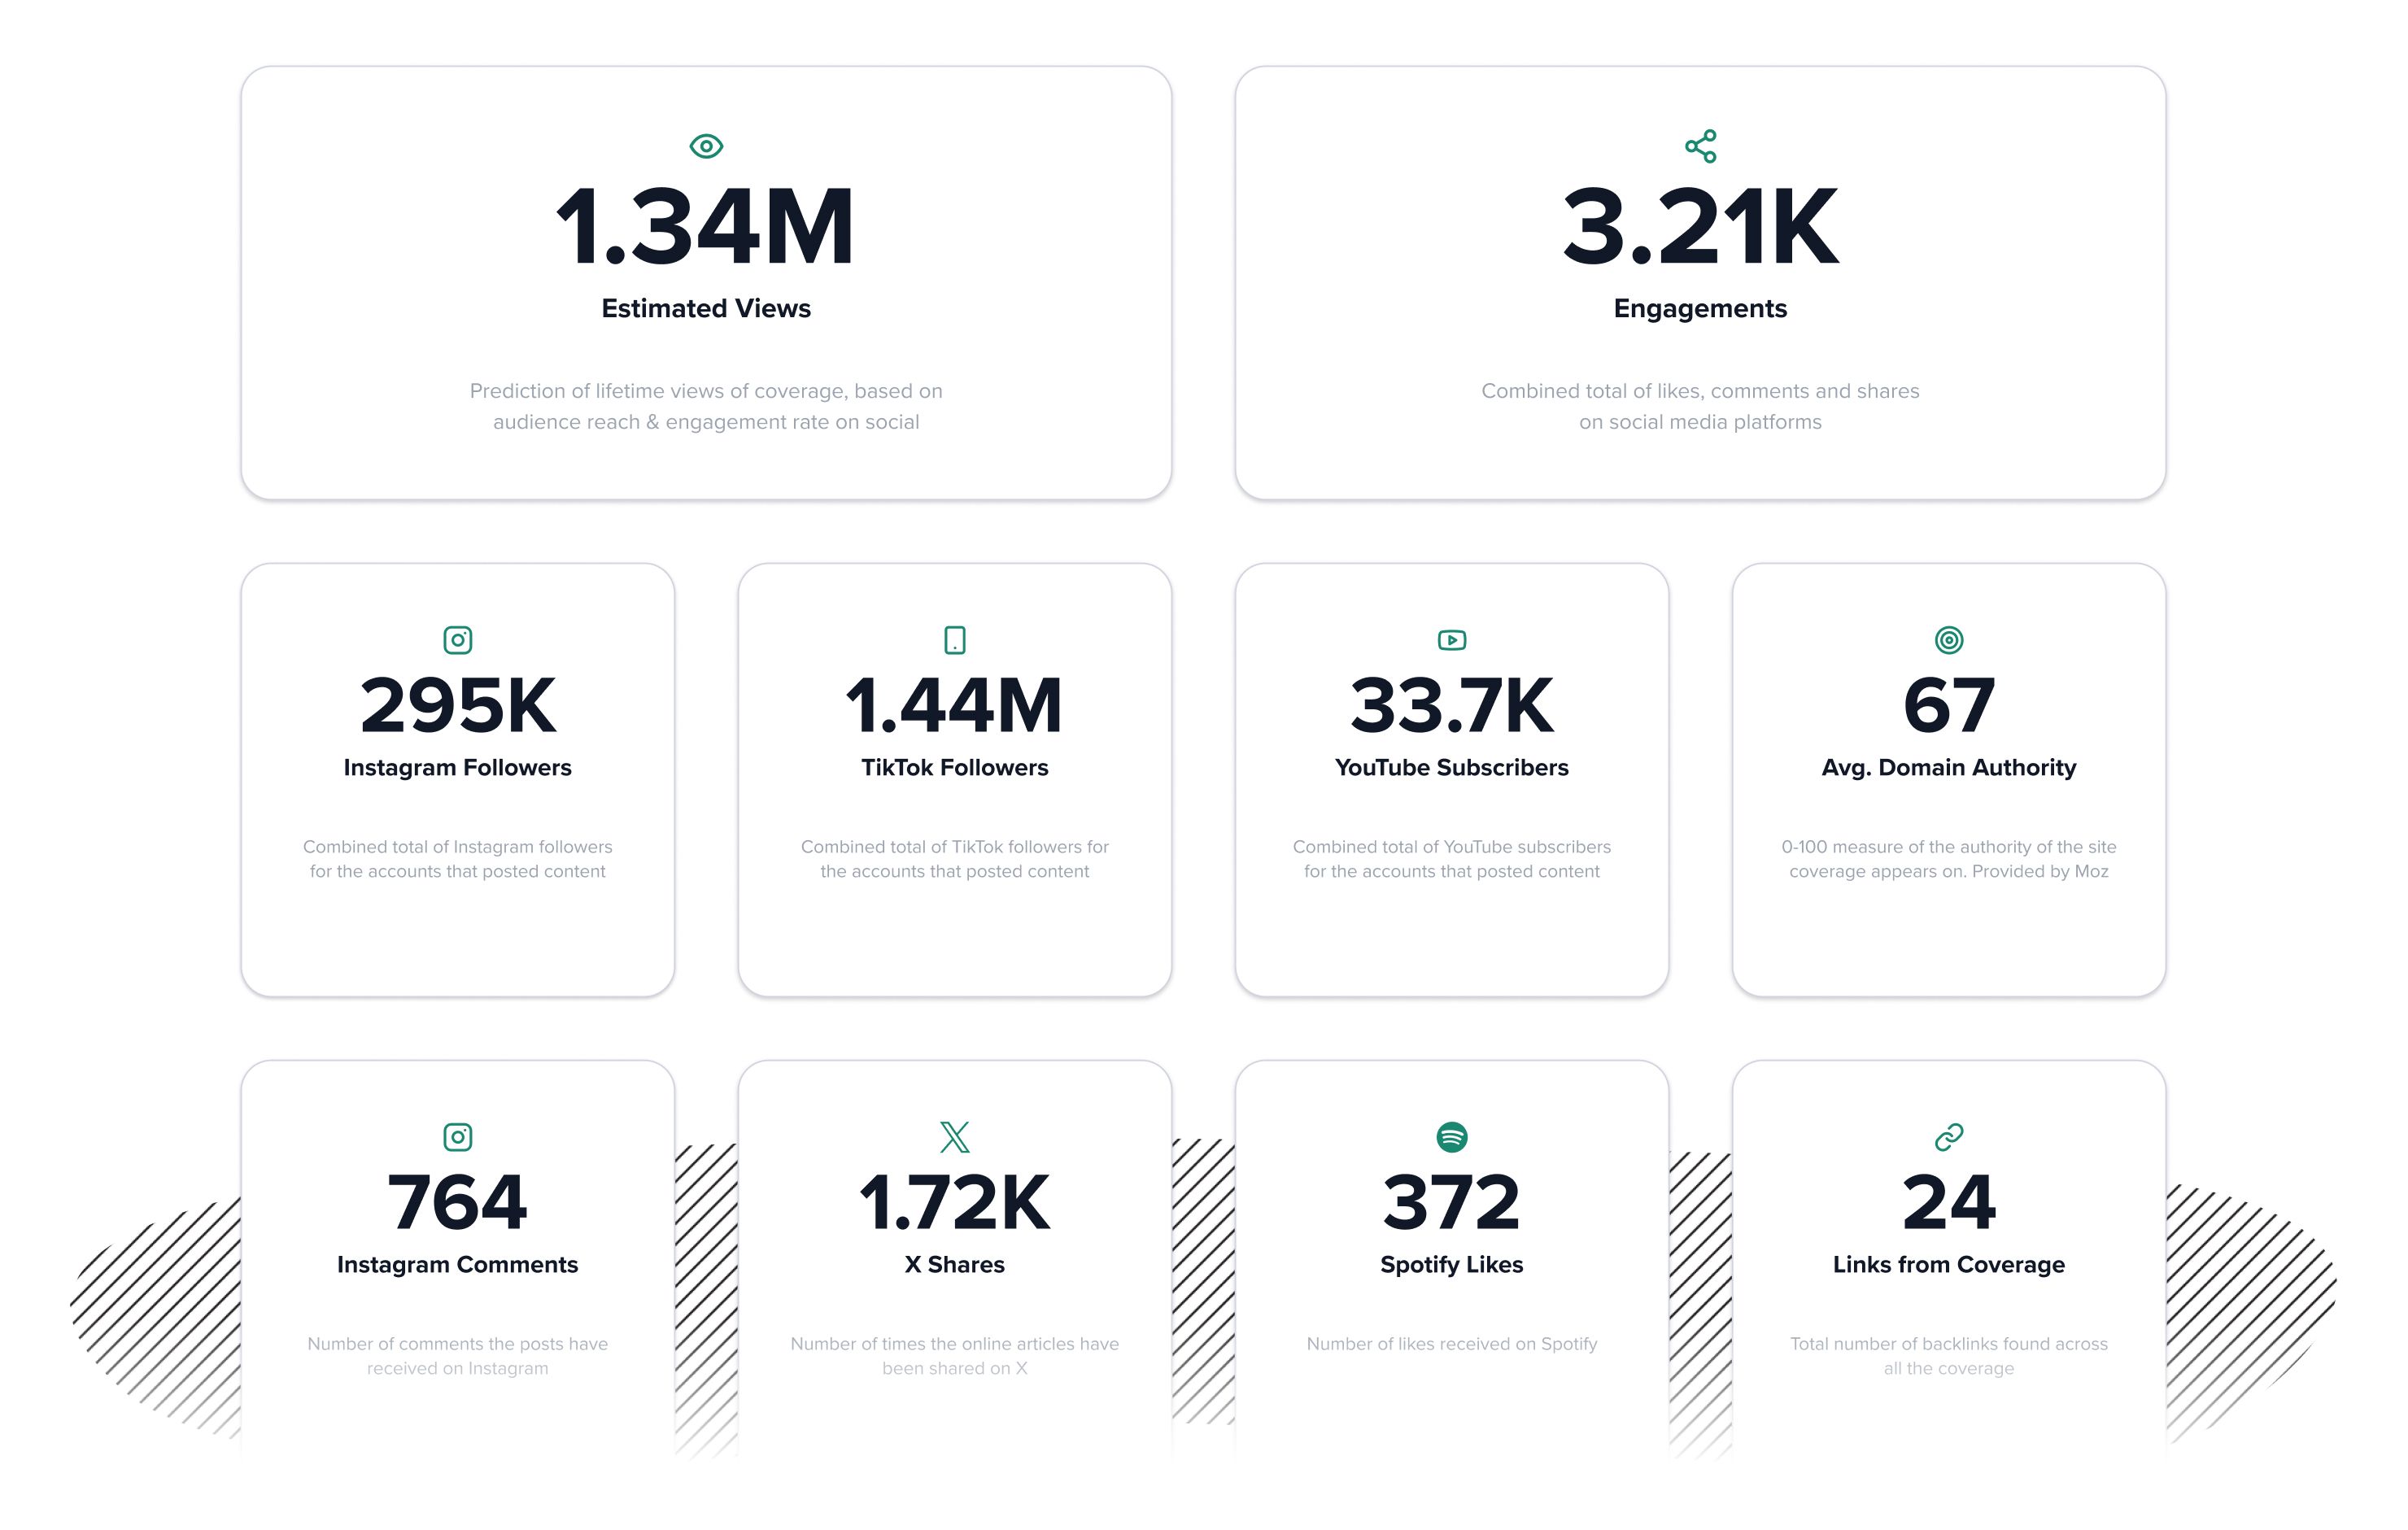
All you need to do is paste in a link to your coverage and we’ll collect screeshots and data like Estimated Views, social shares and relevant audience stats for the outlet or social profile. And we'll present it all nicely for you in our coverage template. No more hunting round for numbers, copy pasting screen grabs or fiddly formatting of hyperlinks. It’s never been easier to measure your media relations coverage accurately.
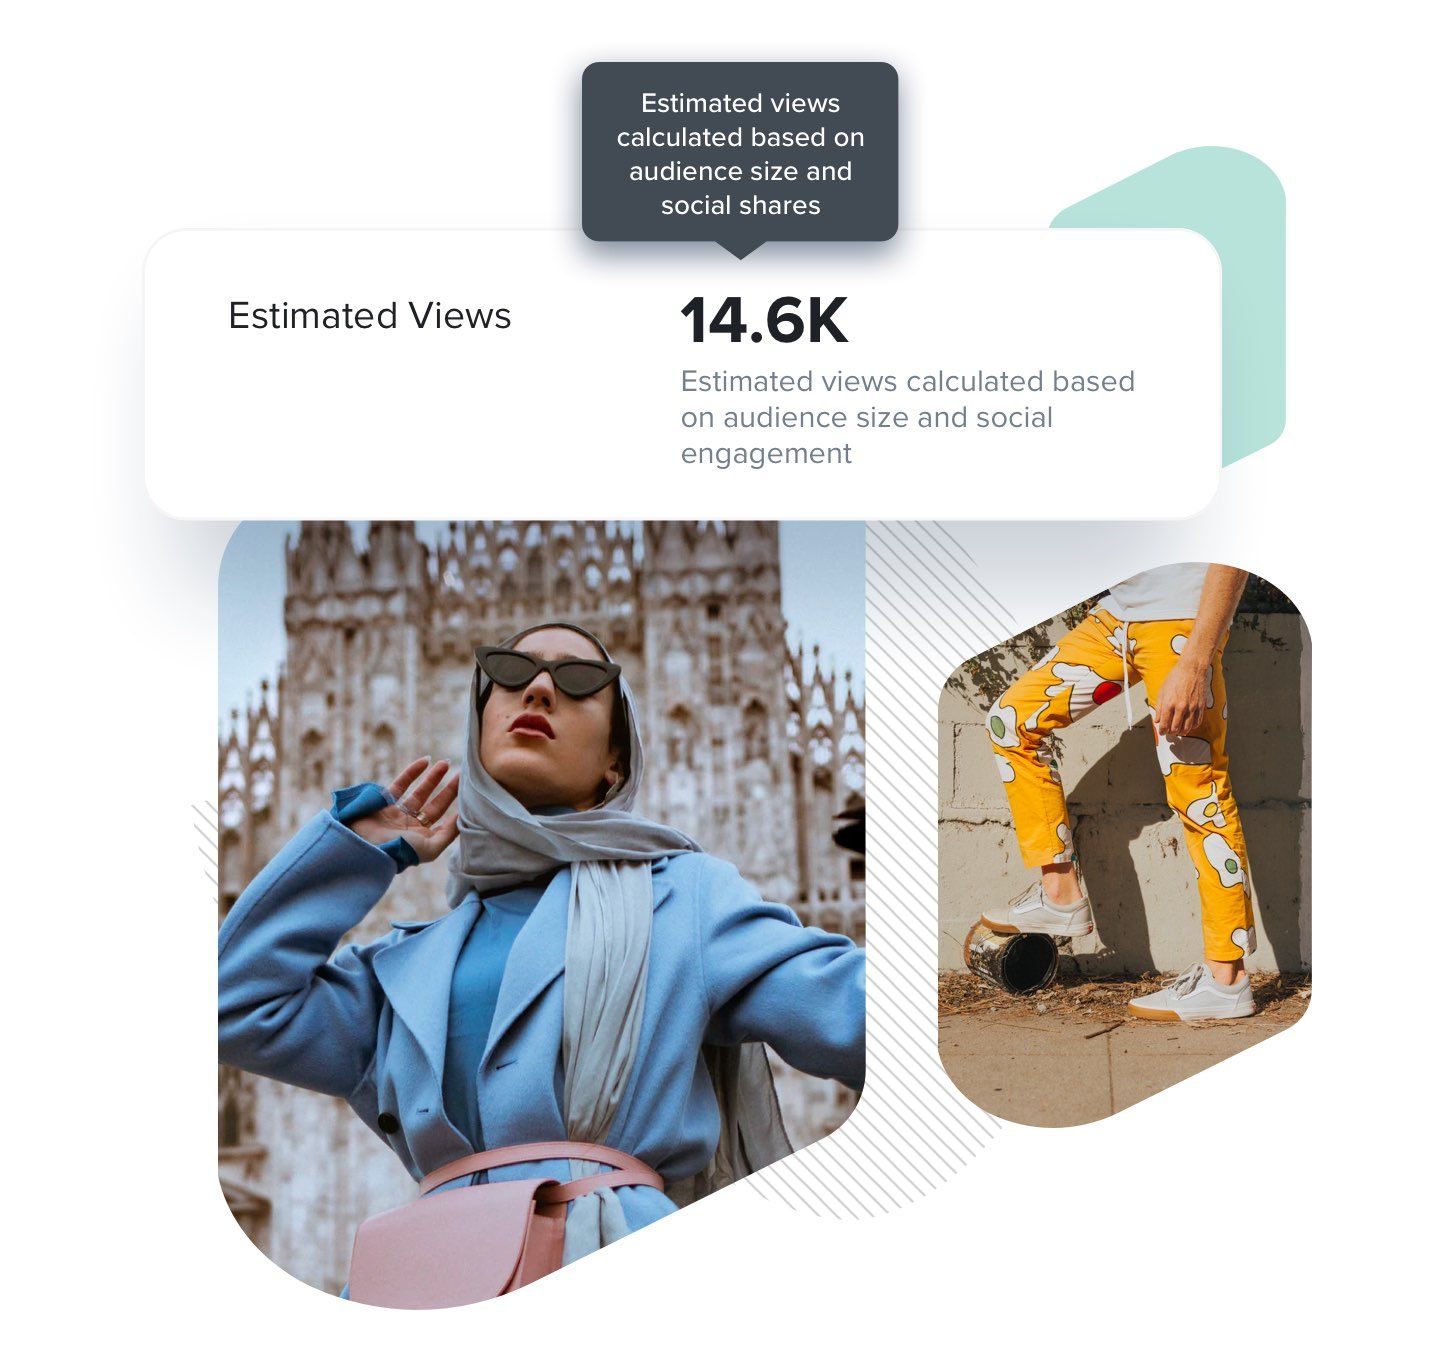
Publisher monthly traffic figures are great for context. But we also predict how many people could actually see the coverage clip or social post over its ‘life-time’. Our unique, established and well-respected ‘Estimated Views’ formula considers the article placement, size and influence of the site and how many shares the clip has received on social networks.
Your valuable data isn’t just shown on individual pieces, it’s automatically tallied up for you! You control which headline stats to highlight, whether you want to showcase overall totals or break them down by platform—it’s easy to add, remove and drag metrics around for complete, curated data perfection.

“It's a big gripe of mine seeing PR saying potential reach is X million or even X billion people. As a brand manager and allocator of budget, you can't take a lot from 'reach data'. We like using the 'Estimated Coverage Views' metric in CoverageBook. It's more realistic which means it's easier for me to compare PR against other areas of marketing.”

Head of Culture & Entertainment, PR & Influencer Marketing, Diageo
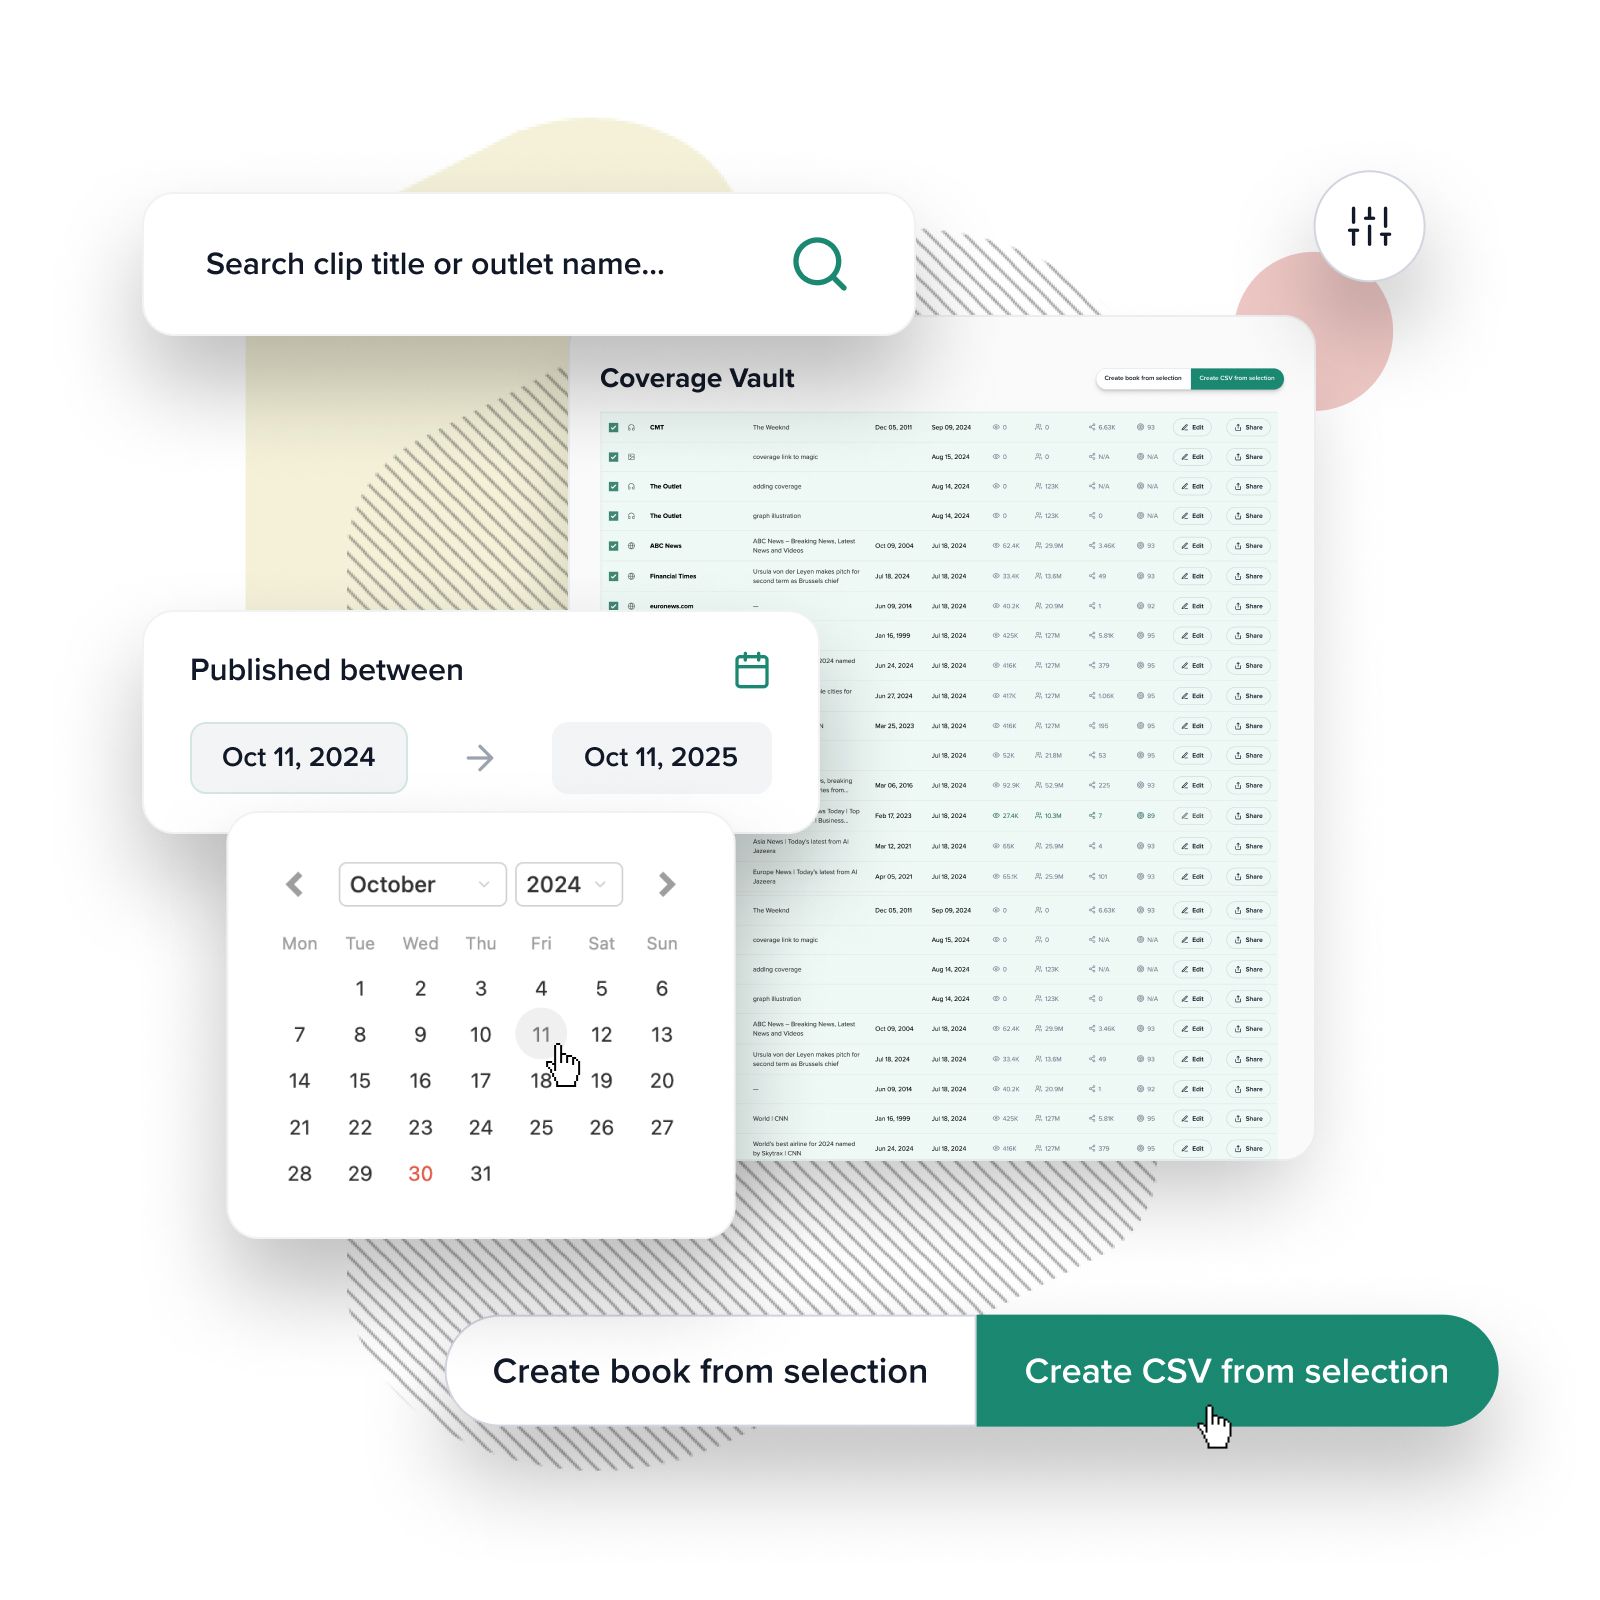
Search your coverage database. Refine by client, media type or time period to spot trends and draw insights. Instantly create new reports from your selections or export all that powerful data in a CSV file to work with in spreadsheets or other tools. With the extra power and flexibility of the Coverage Vault, KPI trackers will become a thing of the past.
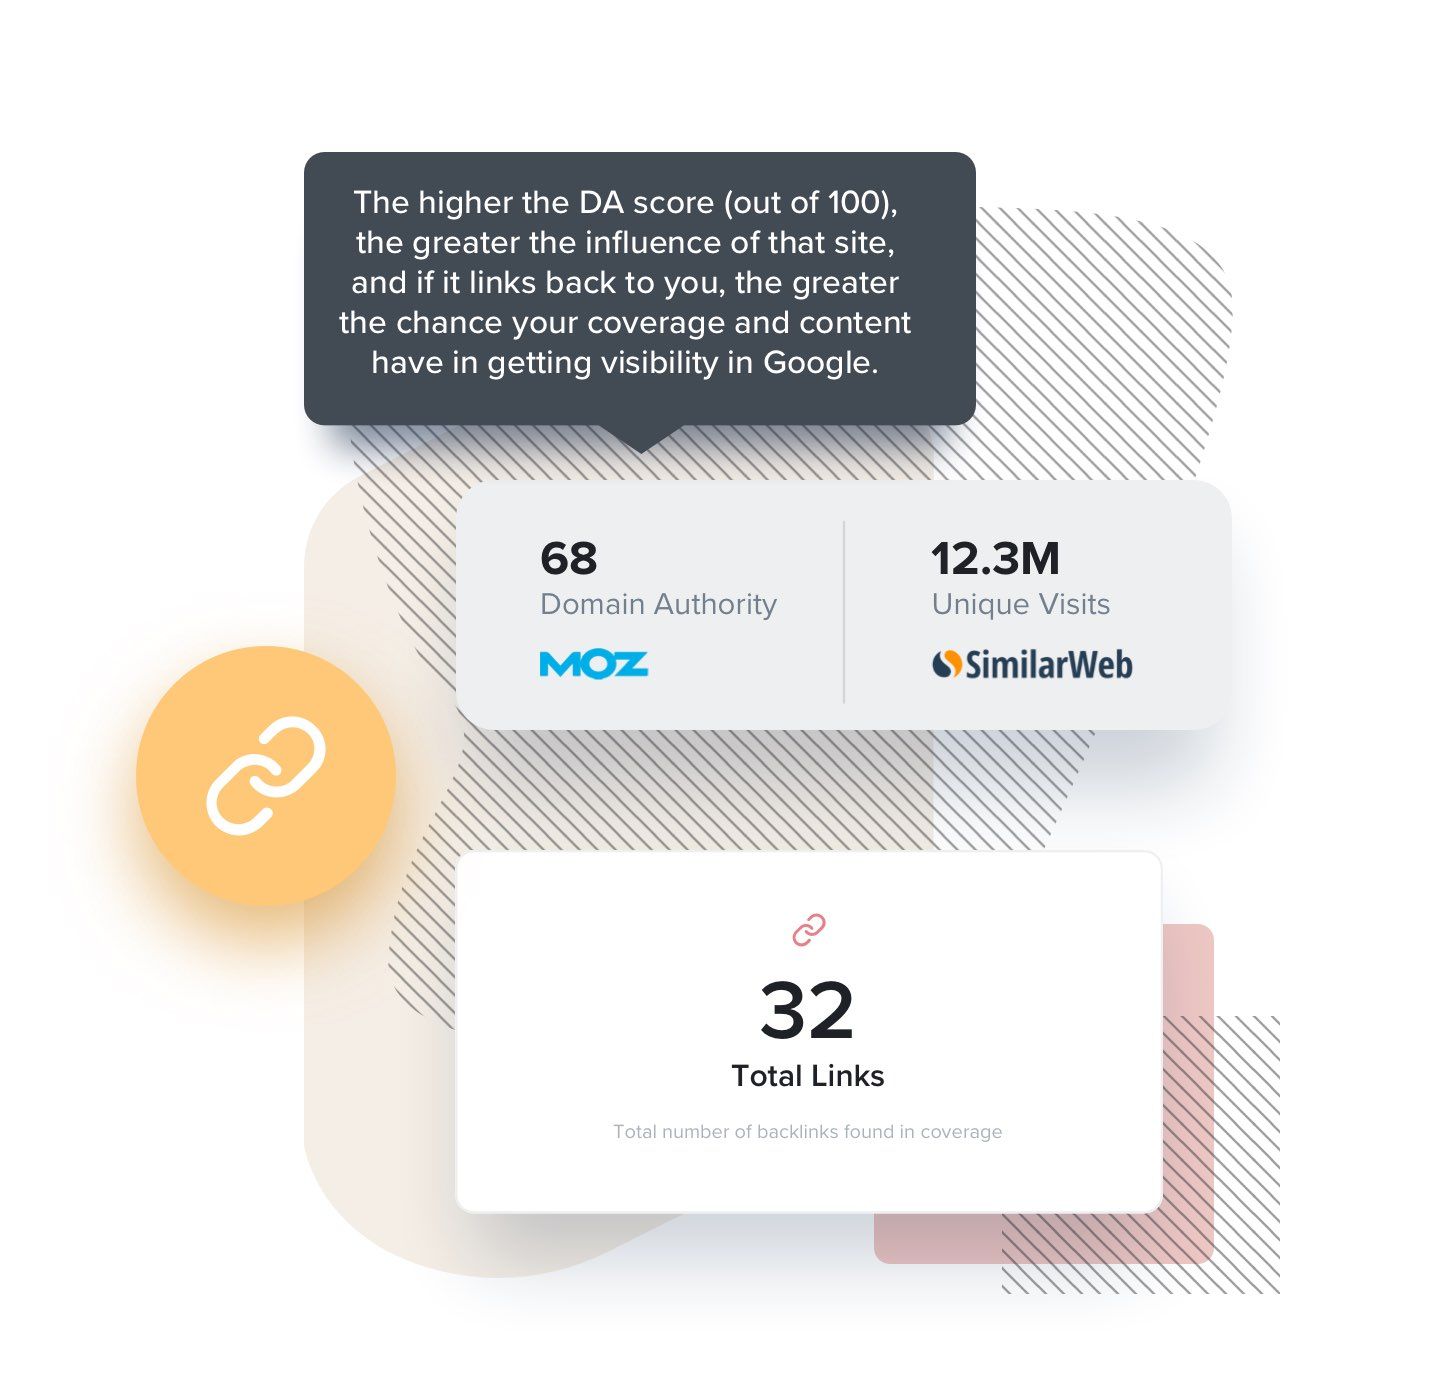
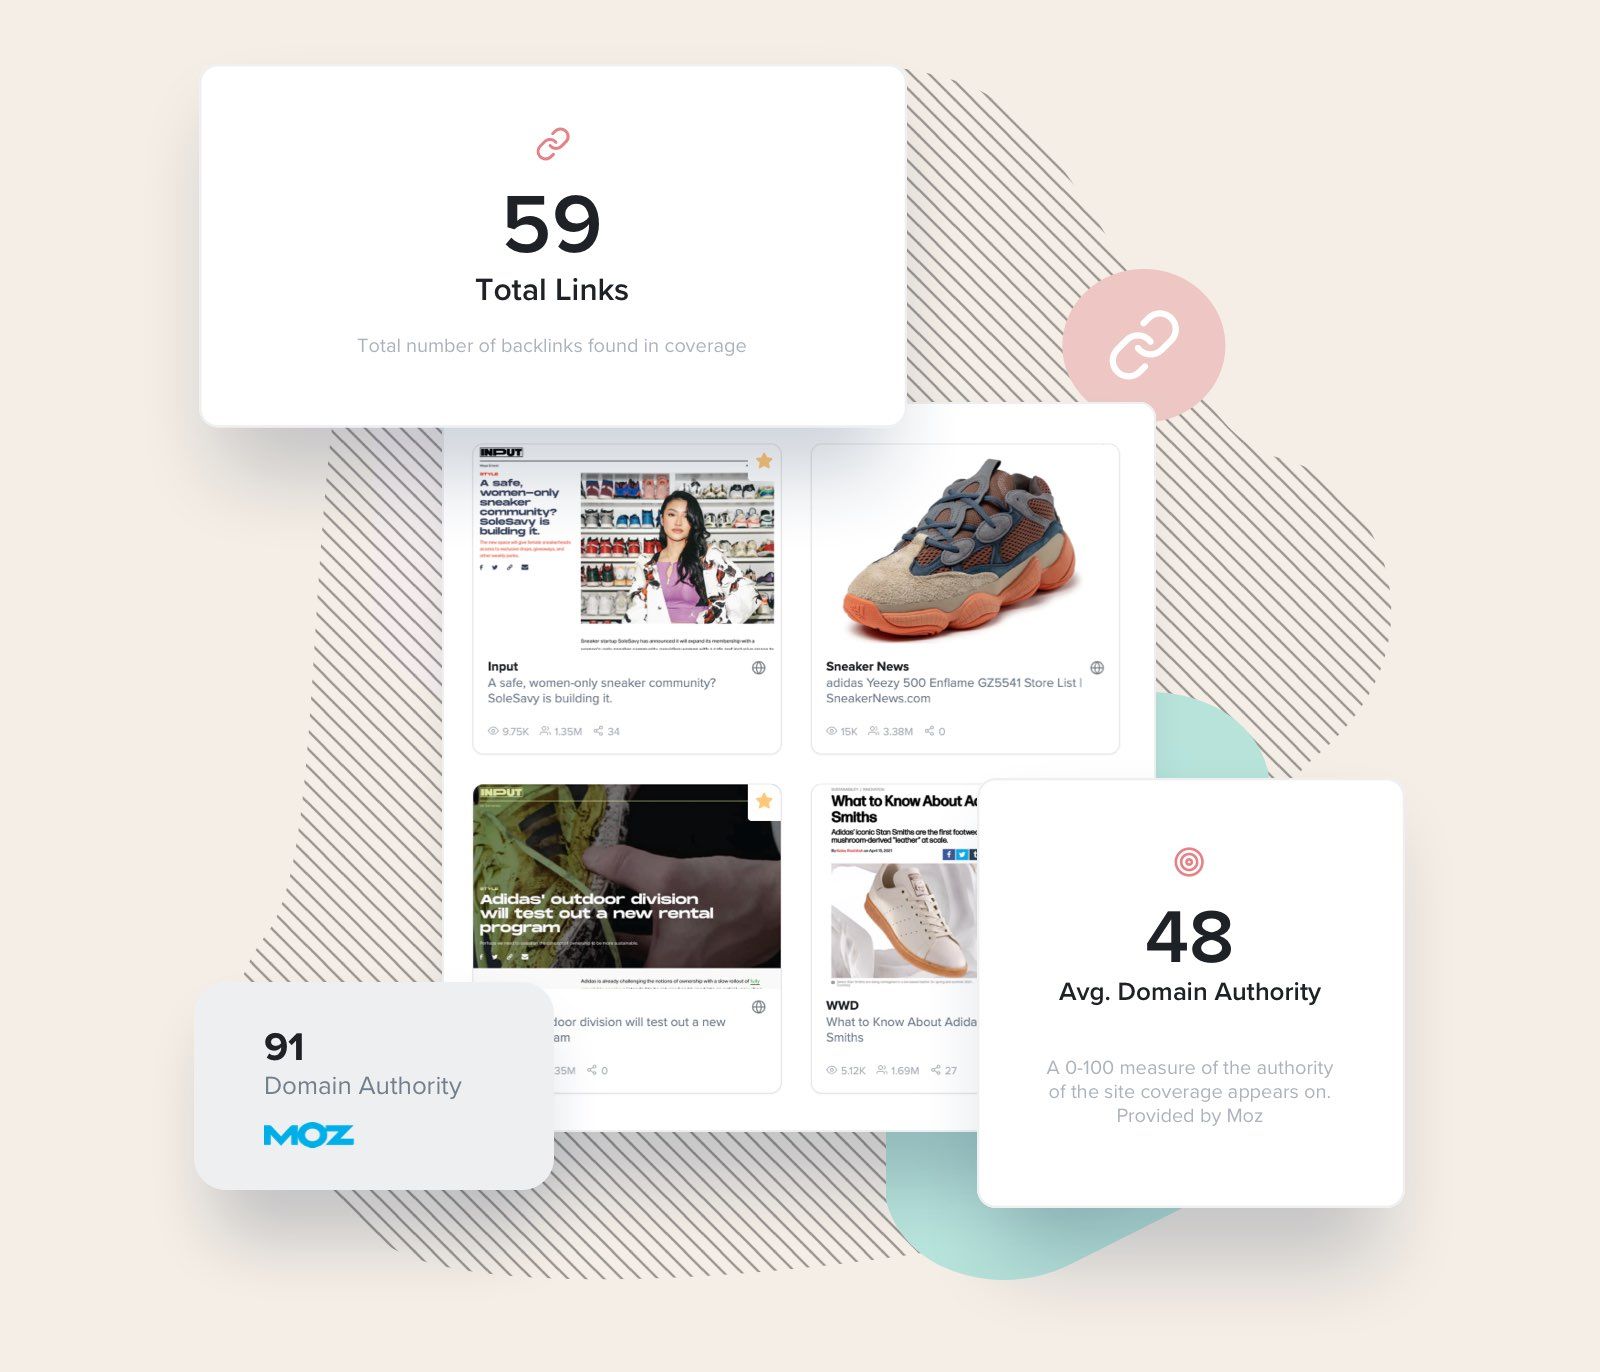
Every piece of coverage you earn from Digital PR that includes a link to your client’s site is contributing to their natural search visibility. So you can and should be reporting back on your contribution to SEO from quality coverage. Let us do the hard work finding and counting the links in your coverage, and analysing their strength through Domain Authority scores.
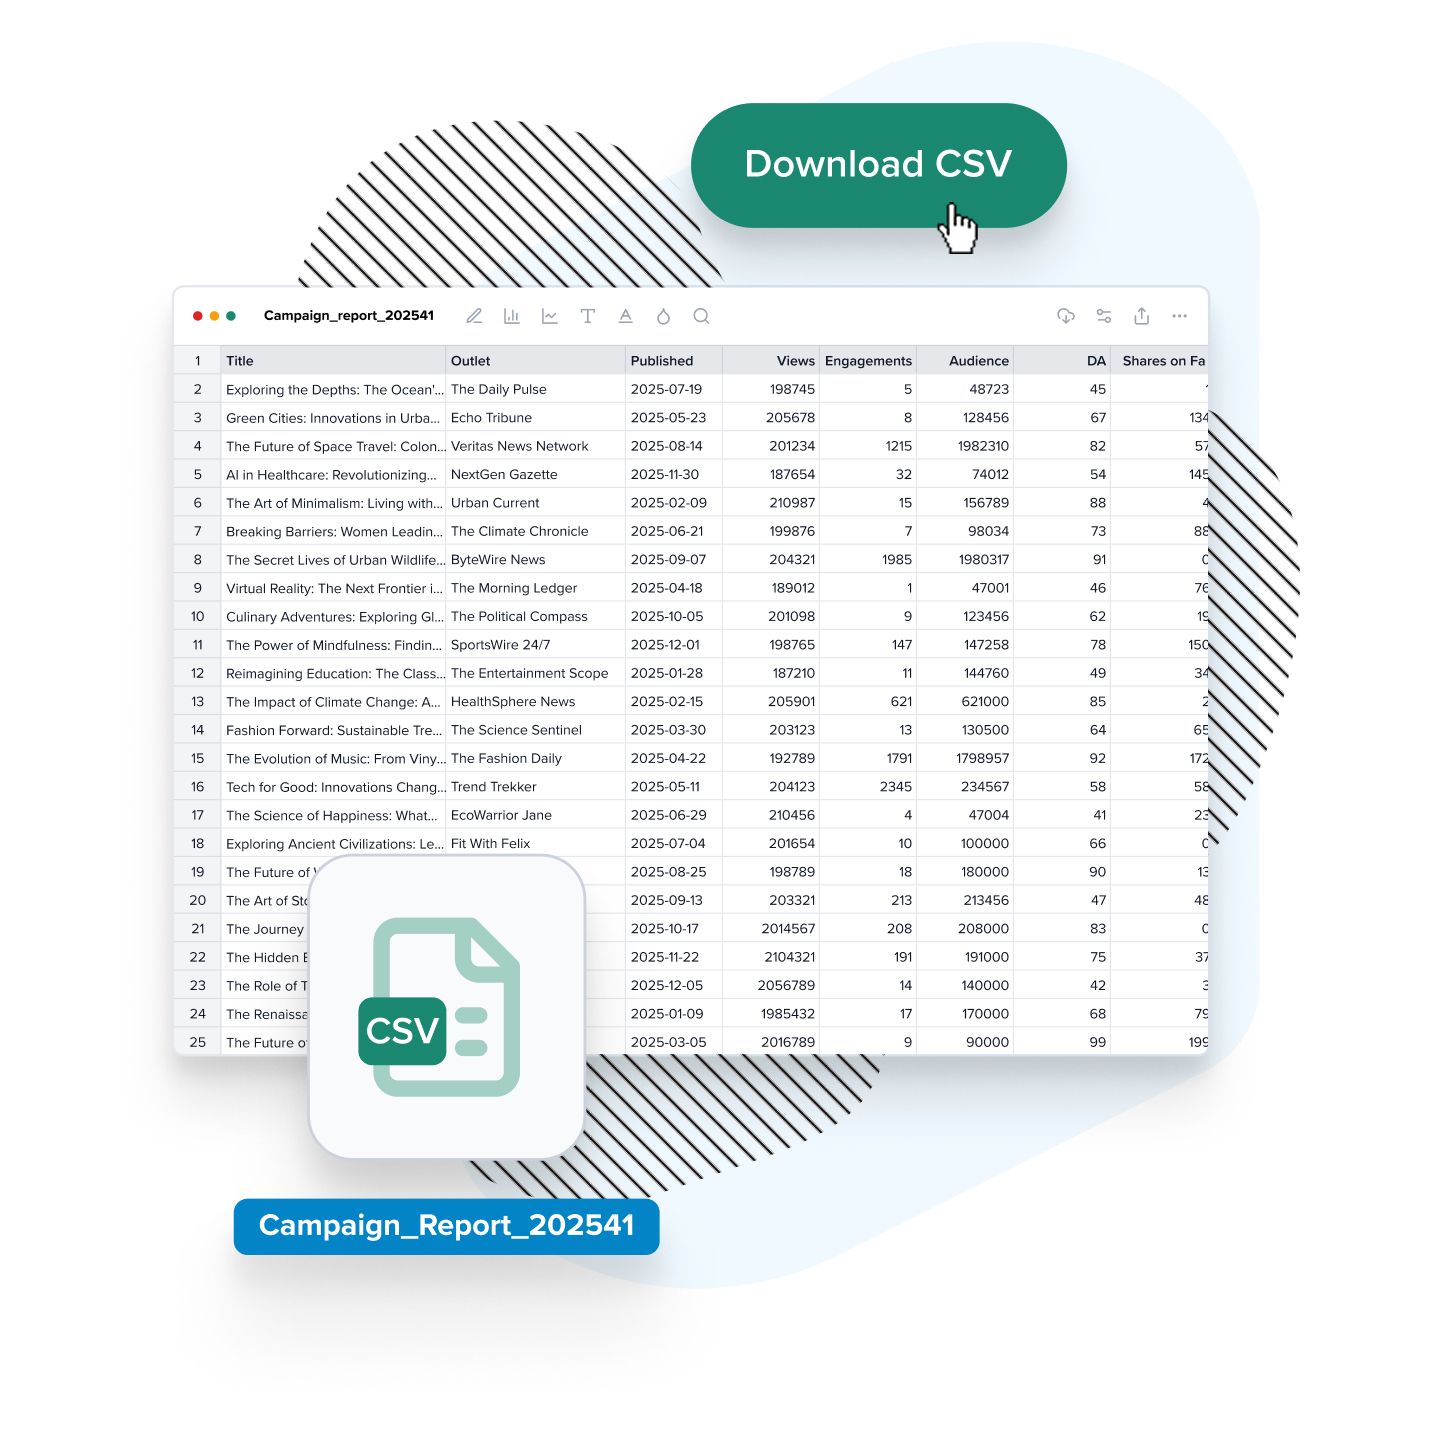
If you just want the numbers without the presentation features, it’s easy to export all your coverage metrics as a CSV file for deeper analysis or custom reporting. Perfect for teams who prefer working with spreadsheets or integrating data into other tools—no templates, just the numbers you need.
“The Domain Authority metric allows us to demonstrate SEO impact from our PR work to clients. We have also tracked the ‘average domain authority’ score of all of the sites we have gained coverage and links on over 12 months. It shows the influential publishers we’re working with which is impressive to clients that care about their search visibility”

Founder, Radioactive PR
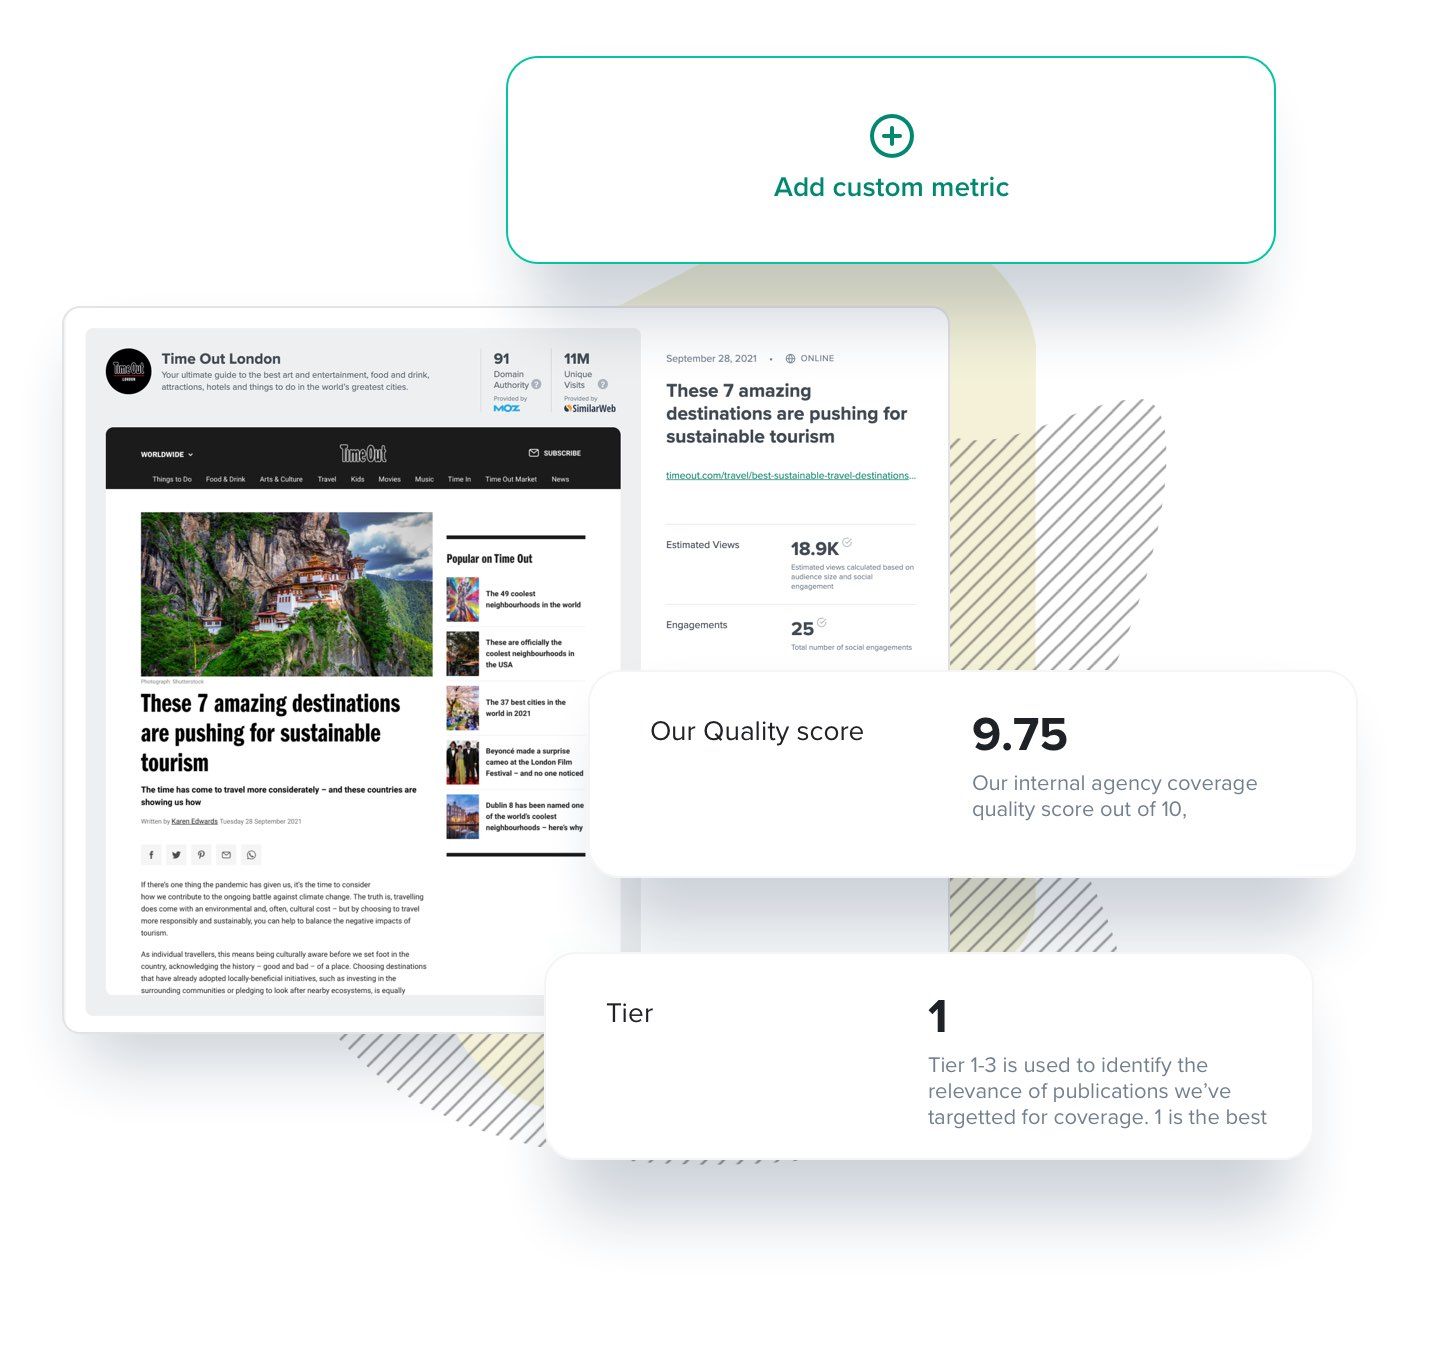
You can also add your own custom metrics to online coverage and social posts, as well as offline pieces. The coverage templates will flex to handle whatever you need. You can even choose how these metrics get totalled up in your summary—as a sum or average.

We all know that not every outlet or publication is immediately recognisable by name, yet can be hugely important for a particular industry or brand. That’s why we pull back a short bio, a logo and of course some metrics that all help to get across the quality or relevance of your coverage. Great for reporting, even better for your next campaign planning.
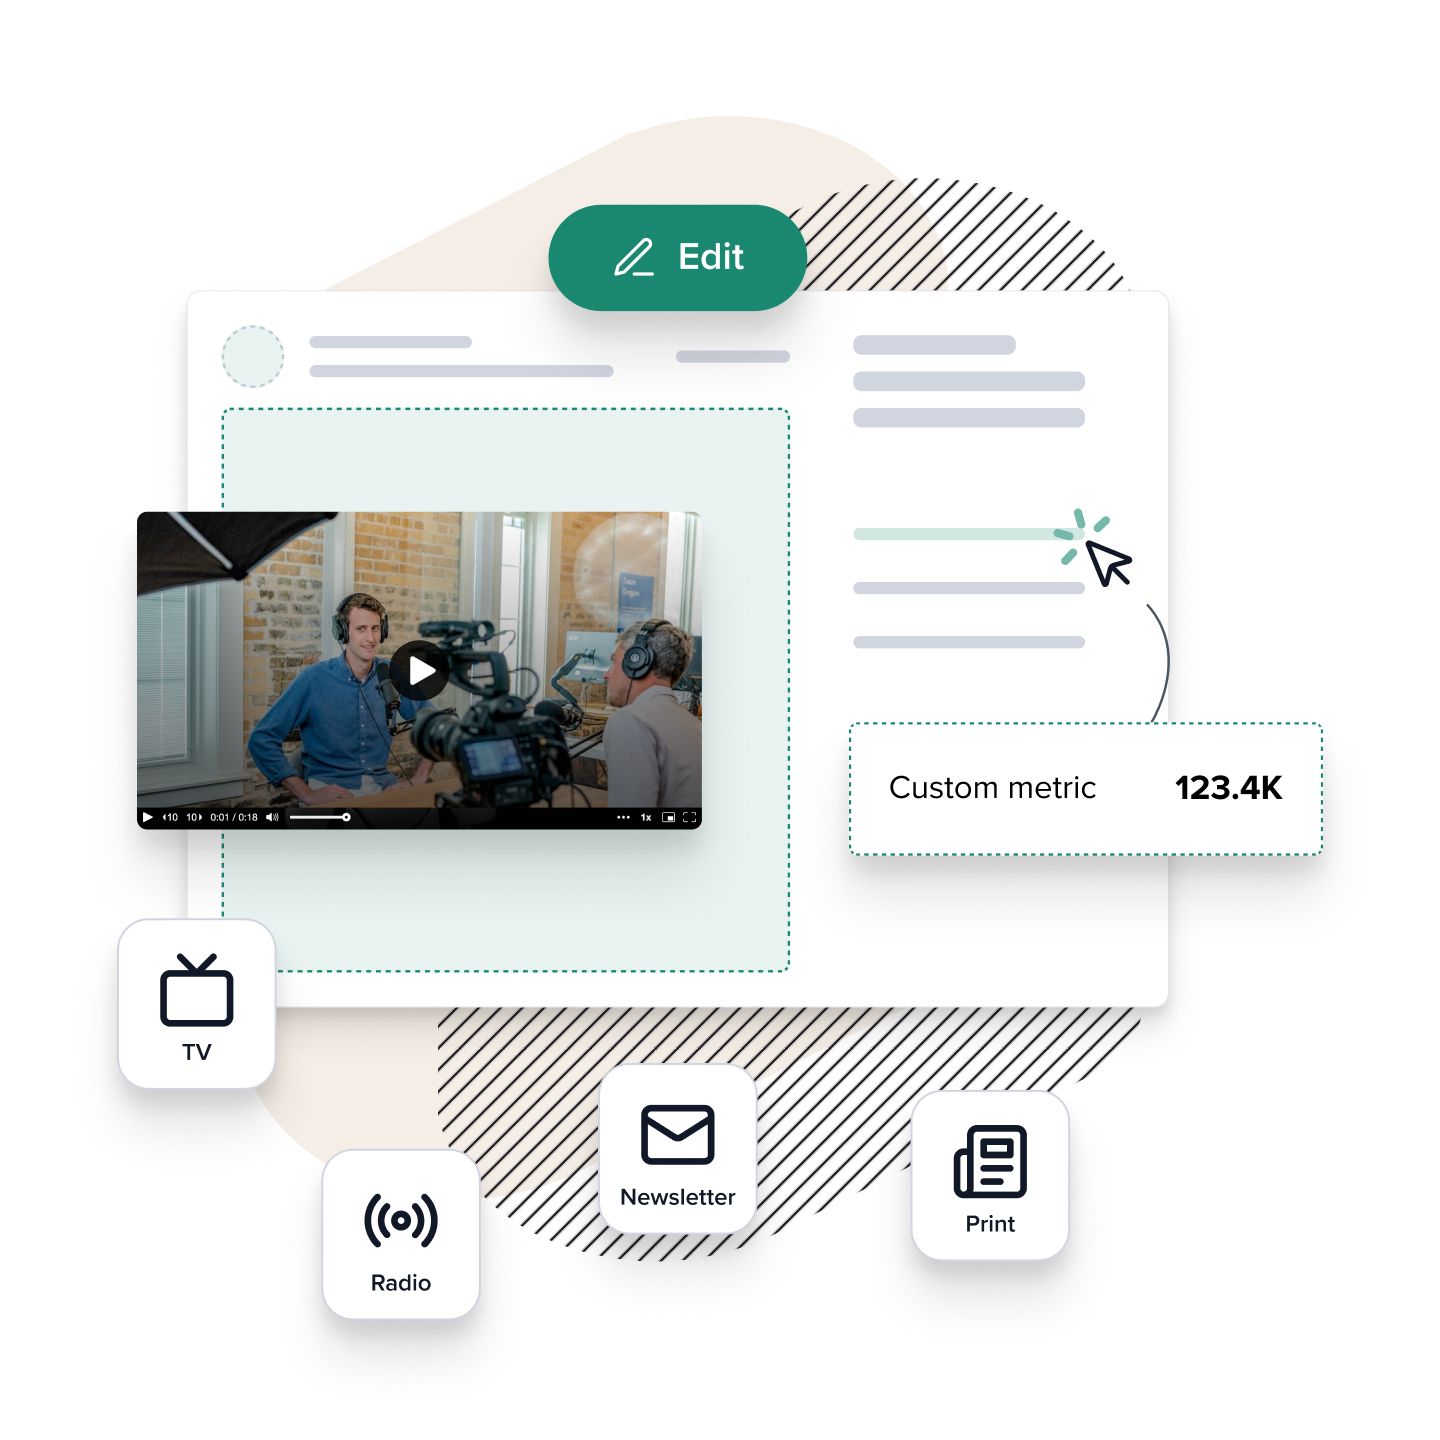
If your coverage is offline, doesn’t have a direct link or is on a platform we don’t support (yet), you can still create a slick, polished report with our customisable coverage template.
Add images, video, audio or PDFs and include your preferred data sources to present stories clearly and professionally… and we’ll automatically tally any metrics up for you in your summary.
CoverageBook is packed full of everything you need to measure coverage effectively. Here's a quick overview of some of the key data points and features included on every plan.
Metrics & Data |
|
|---|---|
| Automated metrics for online articles, X, Instagram, YouTube, TikTok, Spotify, Twitch, Facebook, LinkedIn and more. Just paste the links to your coverage into your report and we'll do the rest. We also offer partial support for many more platforms and can often capture screenshots/embeds, publication dates, titles and more. See how things look for different coverage types |
✅ |
| Full-length screenshots of your coverage. Adjust the image frame to showcase a key mention. | ✅ |
| Playable embeds of social posts and YouTube. Play video and audio right from within your report. | ✅ |
| Estimated Views—our own unique, established and well-respected formula that predicts how many people could actually see the coverage over its lifetime. It considers size and influence of the site and how many shares the clip has received on social networks. | ✅ |
| Ground-breaking Estimated Views metrics for social media posts. It's an industry first in social reporting that raises the bar for honest, realistic PR measurement. | ✅ |
| Social shares and engagements across X, Instagram, Facebook, YouTube, TikTok (likes, shares, comments, ...) | ✅ |
| YouTube stats including views, engagements and subscriber numbers. | ✅ |
| Publication/outlet monthly audience figures provided by trusted traffic data source, SimilarWeb. | ✅ |
| Social influencer follower numbers for major social platforms. | ✅ |
| Contextual outlet data, like publication name, logo and even a short bio for extra context. | ✅ |
| Domain Authority scores from trusted provider Moz to help analyse the strength of links and SEO benefits of coverage. | ✅ |
| Check for backlinks to client's websites (up to 5 separate domains per report), so you can report back on your contribution to SEO from quality coverage. | ✅ |
| Metrics Summary that totals up your overall stats. With drag and drop ordering to give you control over what numbers matter most. | ✅ |
| Metrics Summary Palette containing sum totals of every data point in your report, so you have complete control over which metrics to feature in your summary. | ✅ |
| Custom (user-created) metrics can be added for all types of coverage. Whether you have your own data sources for offline coverage or need to include your in-house scoring systems. | ✅ |
| Hide or show metrics throughout your report. You can even hide the whole metrics summary if the visuals are your priority. | ✅ |
| Copy any report as a template—if you often reuse the same metric settings and visuals for certain clients, copy any report as a template and those metrics and settings will transfer across. | ✅ |
| Export all data as a CSV. If you're an excel wizard or you just need to include your numbers in a separate tracker. | ✅ |
| Coverage Vault - a searchable treasure-trove of all coverage in your account. Search, refine by clients, media type or time periods to spot trends and draw insights. Build new reports from your selections or export all the coverage data in a CSV file. | ✅ |

Let CoverageBook handle the data gathering for you. Start a free trial and see how it all works with your own coverage.
30 day free trial, no commitment, no credit card required.
Annoying Salesperson will NOT call.


Get in touch, we'll be happy to help