
If you use Muck Rack, you already know it’s one of the best tools in PR.
The journalist database is excellent, the pitching workflow is efficient, the monitoring does a lot of the heavy lifting.
But here’s something most Muck Rack users find out pretty quickly:
It doesn’t catch everything.
A piece slips through the alerts or a journalist emails you directly with a link or a client spots something you missed.
And when that happens, a lot of Muck Rack users open a spreadsheet and start logging the coverage manually alongside what Muck Rack found.
That spreadsheet is a big gap in the PR workflow for Muck Rack users and the problem is that a spreadsheet is just storage.
The spreadsheet doesn’t tell you how many people actually saw a specific article or help you understand which PR activity drove the best coverage. And it definitely isn’t ready to show a client in a presentation.
That’s what CoverageBook is for.
In this article, you’ll see:
- Why Muck Rack’s reporting is built for a different job than the one most PR teams actually need done
- How CoverageBook sits alongside Muck Rack in a lot of PR teams’ workflows
- When you don’t need CoverageBook (and when you do)
By the end of this article, you’ll have a solid understanding of whether CoverageBook and Muck Rack are the tools for your team and where they might fit together.
No monitoring tool catches everything so most Muck Rack users are already maintaining a second list
Muck Rack, like all media monitoring tools, is working with an incredibly hard problem.
Think about what it’s actually trying to do: scan the entire internet in real time, identify every mention of your brand or client, filter out the noise, and surface what matters across digital, print, broadcast, and podcasts.
Full credit to Team Muck Rack: they built a product that does this remarkably well but not perfectly.
The gaps aren’t a failure of Muck Rack specifically – they’re more structural than that.
Realistically, Muck Rack users experience a few problems with keeping their coverage database up to scratch:
- Some publications don’t get indexed quickly
- Some coverage appears in newsletters, roundups, or niche trade titles that sit outside the standard crawl
- Sometimes a journalist files a piece and forgets to tag it properly
- And frankly, sometimes you find out about a hit because the client forwards you a link at 9pm
What we’ve seen from working with hundreds of Muck Rack customers, is that PR teams supplement Muck Rack constantly whether it’s with Google News searches, direct alerts from journalists, tips from clients, manual checks on key publications after a campaign goes live.
The result is that most Muck Rack users end up with a second layer: A spreadsheet.
That’s usually a shared Google Sheet where someone from the team has been working hard to paste in the URLs that Muck Rack missed.
And that’s not a criticism of Muck Rack alone – it’s more an objective fact that everyone running PR campaigns eventually comes to discover (maybe you already know!)
CoverageBook is a better solution than a Google Spreadsheet
So if you’re already using the Spreadsheet, why would you bother to add in CoverageBook as well?
Simply because the spreadsheet doesn’t cut it. For example, it has no screenshots, no automated metrics, and let’s face it, no-one sharing the spreadsheet as a deliverable with the client so someone has to go and manually pull together a presentation using all the URLs in it.
But when CoverageBook asked customers how they use Muck Rack and CoverageBook together, three patterns came up again and again:
CoverageBook is a hand off between Muck Rack and reporting
The most common response was that Muck Rack does the monitoring. CoverageBook is where the verified, curated list of coverage lives and gets reported on.
The two tools don’t compete; they hand off to each other at the point where monitoring ends and reporting begins.
CoverageBook is the single home for all coverage
Teams use CoverageBook as the single home for all their coverage, regardless of source. Muck Rack alerts, manual finds, client tips, Google News.
Everything goes into CoverageBook. The monitoring tool becomes one input among several rather than the only source of truth.
Teams can invite their client/stakeholder into a CoverageBook report
The PR team lives in Muck Rack. The client gets a CoverageBook report. The same coverage, presented differently for a different audience.
All three of these patterns point to the same underlying truth: Muck Rack and CoverageBook are doing different jobs.
And once you see that, the question stops being “which one should I use?” and starts being “why don’t I have both?”
Muck Rack helps build your portfolio but CoverageBook reports on your coverage.
Muck Rack does have reporting functionality which allows you to get PDF exports, shareable presentations, Newsletters built from a Coverage Report.
Any comparison article that ignores this isn’t being straight with you. Here’s an example of a Coverage Report for a selection of Articles in a Muck Rack account:
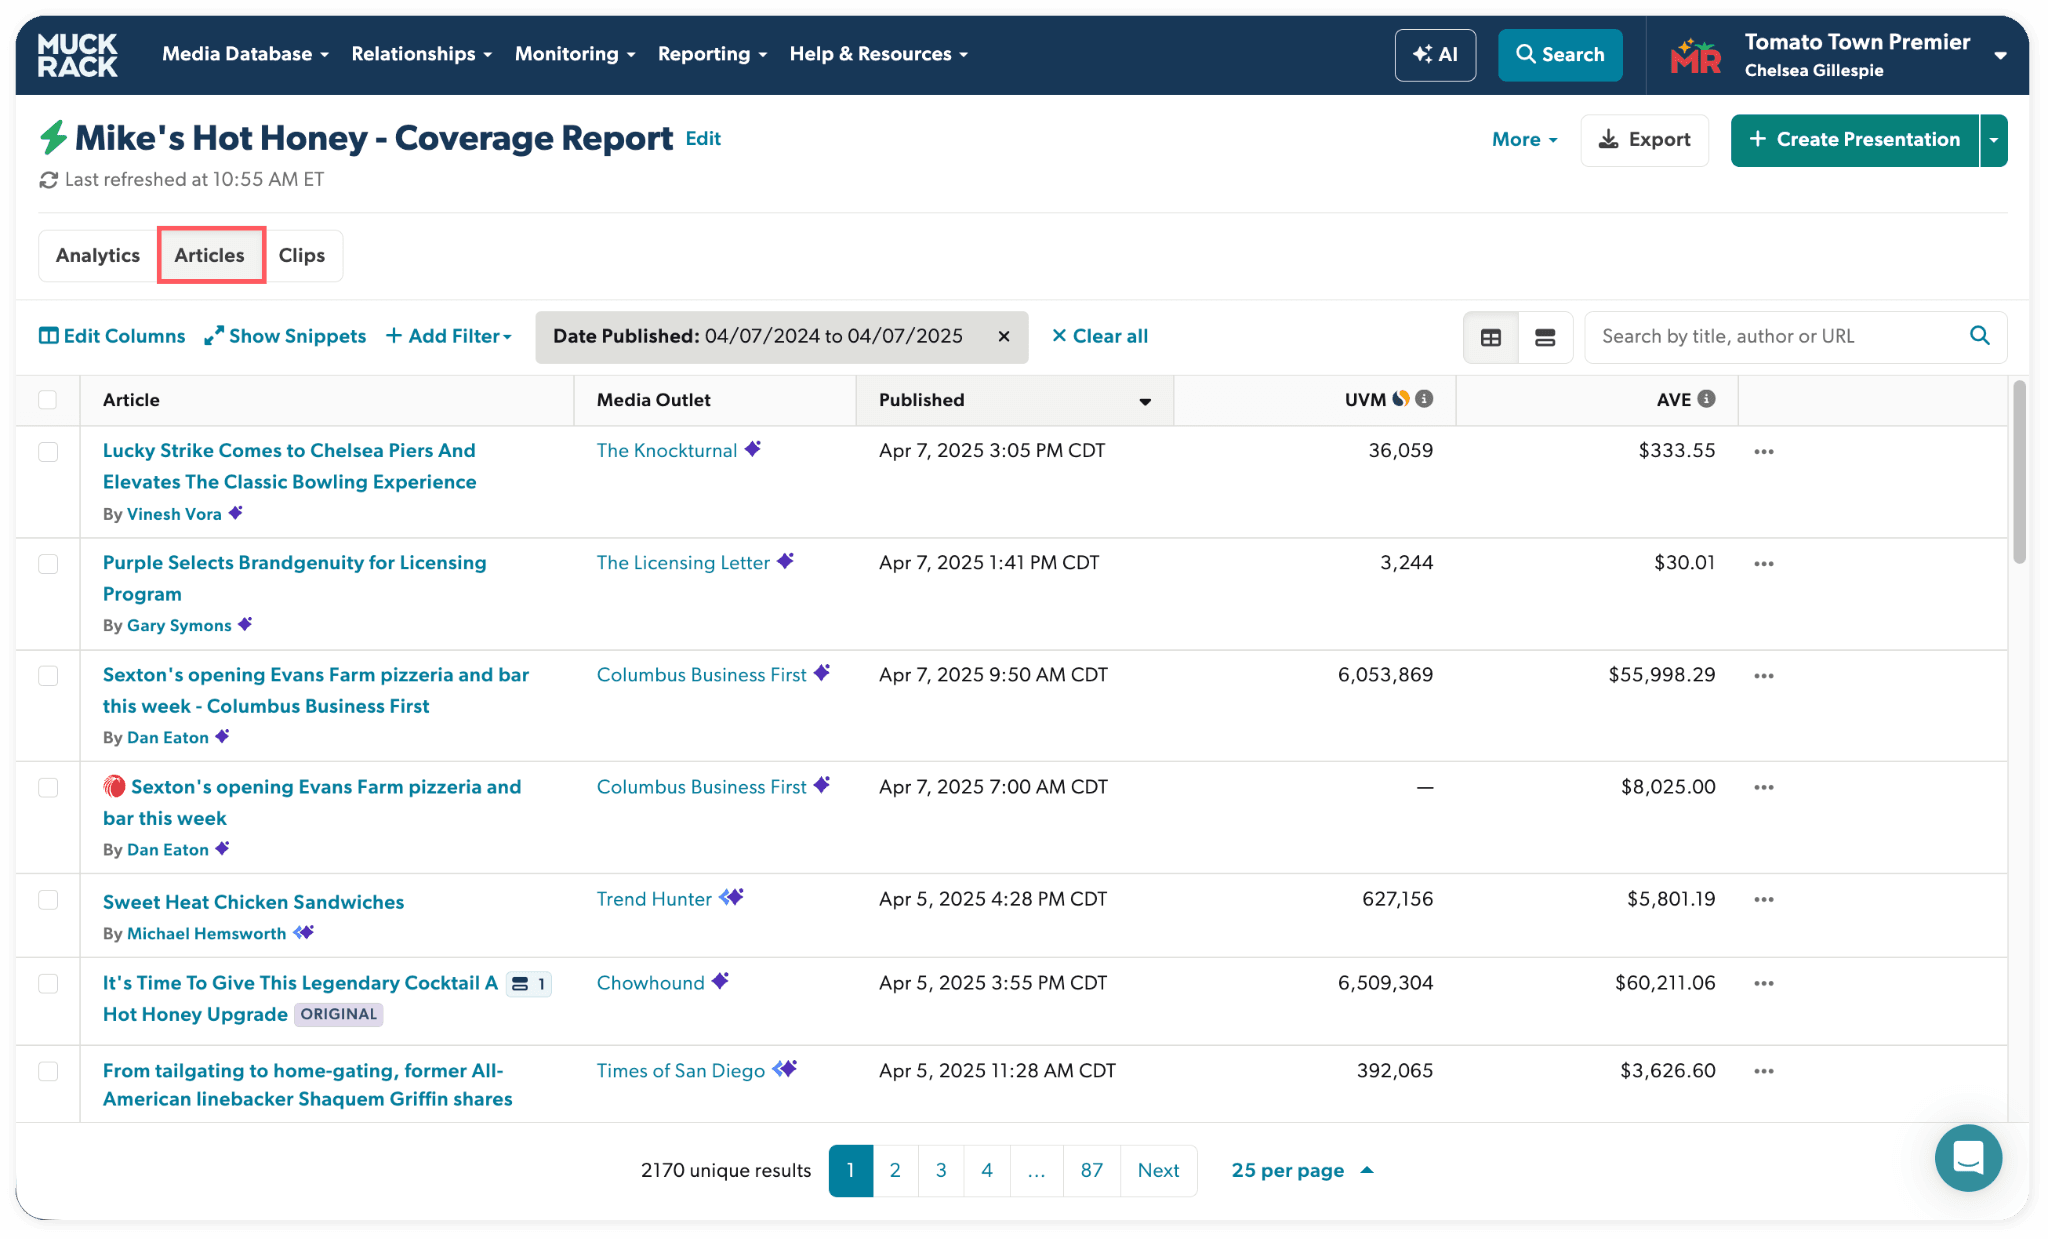
The difference here isn’t about what format the output comes in – but really about how Muck Rack and CoverageBook think about reporting differently.
Muck Rack’s Coverage Reports are built around portfolio-level metrics: total UVM, total AVE, sentiment percentage across all coverage, share of voice against competitors, engagement totals.
Individual articles are rows in a table (see the example above) and that’s a great way for someone who wants to interrogate numbers at a macro level to look at the data.
For example, they might ask, ‘how much coverage did we get, what was the sentiment, how did we compare to last quarter?’
That’s a legitimate use case. If your stakeholder lives in Muck Rack and pulls their own dashboards, Muck Rack’s reporting is probably fine.
But CoverageBook is built around the coverage itself.
Every hit gets its own treatment: a screenshot of the article as it appeared, the headline, the outlet, and a per-piece Estimated Views figure.
The analysis features such as editorial format classification, brand prominence scoring, sentiment tagging, PR activity tagging sit at the article level, not the portfolio level.
That means that you can see more than just how much coverage you got. It unlocks insights into what kind each piece was (a feature, a review, a news mention, a roundup), how prominent your brand was within it, and which PR activity drove it.
That’s a different kind of insight to a sentiment percentage across your whole portfolio and because of that, you unlock the kind of insight that actually changes how you brief the next campaign.
UVM and Estimated Views are not the same number
Muck Rack’s reports use site-wide Unique Visitors per Month (UVM) to the publication’s domain.
That means, if an article appears on a site that gets 10 million visitors a month, Muck Rack records 10 million UVM for that hit.
The problem is obvious: not everyone who visits a website reads every article on it.
Attributing the full site audience to a single piece of coverage is how you end up presenting numbers that your client doesn’t believe and your boss can’t defend – and that isn’t going to end well.
To avoid this obvious pitfall, CoverageBook uses Estimated Views instead.
Estimated Views is a per-piece estimation of how many people are likely to have actually seen a specific piece of coverage in its lifetime.
Estimated Views are a proprietary algorithm from CoverageBook and factors in…
- The traffic to the site – site-wide visits data is still a major factor – the more traffic the site has, the more people are likely to see your coverage.
- How much content does the site have? – if a website has only a few pages, a higher percentage of the overall traffic will see your page. But if a website has thousands of pages, a lower percentage of the traffic would likely see a specific page.
- If the article is on the homepage or deeper in the site – If the coverage was on the homepage it will receive more of the overall traffic but if it’s hidden deeper, fewer people are likely to find it.
- How many times was the coverage shared on social channels? – If an article has been shared a lot on social channels (we pull X, Pinterest and Facebook shares), we’ll amplify the views to account for the additional sharing activity, where more people are likely to have viewed the piece.
It still uses sitewide traffic as a major input but it adjusts it down to produce a realistic per-piece figure. CoverageBook describes it as “a close equivalent to counting ad impressions on a specific page.”
The result is a number that’s smaller than UVM, but one you can actually stand behind in a client meeting.
“We now use this tool daily to augment our reporting from Muck Rack, and for executive-level presentations, there is no better tool than CoverageBook. It organizes and segments our earned coverage in ways that are easily digestible for C-suiters and board members.” –
Colin M., Senior Director, BG Strategies Group
CoverageBook analyses coverage at the article level. Muck Rack doesn’t
Beyond the report format, CoverageBook has been building a set of analysis features that sit at the article level (something Muck Rack’s reporting doesn’t do.)
Editorial format classification automatically identifies whether a hit is a feature, a review, a news article, an interview, or a roundup.
Over time, this tells you whether your PR activity is generating the kind of coverage you actually want — not just coverage in general.
Brand prominence scoring gives each piece of coverage a 0–100 score for how visible your brand was within it.
A piece where you’re the main subject scores very differently to a piece where you’re mentioned in paragraph seven of a roundup. Both are coverage. They’re not the same thing.
PR activity tagging lets you record which tactic drove each piece — a product launch, a thought leadership pitch, a spokesperson placement, a reactive PR moment. Once you have that data across a campaign or a retainer, you can start to see which activities are actually producing the best coverage. That’s the kind of insight that changes how you plan the next campaign.
Sentiment tracking works at the article level, rather than as an aggregate percentage across your whole portfolio.
None of these features exist in Muck Rack’s reporting layer. They’re not gaps in Muck Rack’s product because Muck Rack isn’t trying to do this.
But if you want this kind of analysis on your coverage, CoverageBook is where you get it.
Getting your Muck Rack coverage into CoverageBook takes about two minutes
Hopefully by this point, you’re sold on the benefits of using CoverageBook alongside your Muck Rack workflow.
Unfortunately, there’s no native integration between Muck Rack and CoverageBook.
But in practice, it doesn’t matter much because the handoff is genuinely simple (and you may already be pulling the coverage from Muck Rack into a spreadsheet anyway!). But here’s how some teams do it:
- Export your Muck Rack Coverage Report as Excel – The Articles sheet has a clean URL column with a direct link to every piece of coverage.
- Copy the URL column
- Paste into CoverageBook. It accepts multiple URLs at once
- CoverageBook auto-generates screenshots, Estimated Views, social engagement, and outlet data within minutes
This takes only a few minutes end to end.
If you’d rather capture hits as they come in rather than in a batch at the end of the month, CoverageBook’s Clipper browser extension lets you add individual articles directly from the browser.
When a Muck Rack alert surfaces a hit, you can clip it straight into CoverageBook without going through the export workflow.
For teams who prefer to build their report incrementally throughout the month rather than in one go at the end, this is sometimes the preferred approach.
You don’t need CoverageBook if your stakeholder lives in Muck Rack
If your stakeholder actively logs into Muck Rack and interrogates the dashboards themselves, you probably don’t need CoverageBook.
The native reporting is sufficient for a team that lives inside the platform and doesn’t need to communicate coverage to anyone outside it.
If you’re an in-house team at a company where the comms director pulls their own Muck Rack reports and is happy with aggregate data, that’s a use case where CoverageBook might not fit in with your workflow.
That said, we have found those to be edge cases and really, CoverageBook is most valuable in two situations:
The first is when you need to communicate coverage to someone who doesn’t live in Muck Rack such as an external client, a CMO, a board, a new business prospect.
These are people who want to see the coverage, not interrogate a dashboard. They want to know what it looked like, where it appeared, and whether it was any good. CoverageBook produces something they can actually engage with.
The second is when you want to analyse the coverage itself at a piece-by-piece level
Understanding editorial format, brand prominence, which activities are working aren’t possible using UVM like Muck Rack does. CoverageBook helps you understand what has happened and whether it’s meaningful or not.
Muck Rack and CoverageBook are not competing for the same job
In summary, Muck Rack and CoverageBook aren’t direct competitors to be chosen one over the other. Instead, they perform different parts of a modern PR workflow.
Muck Rack is where you find journalists, pitch them, and track what gets published. It’s a workflow tool, and it’s excellent at it.
CoverageBook is where the coverage that workflow produces gets understood and communicated.
It’s the tool that picks up where Muck Rack’s reporting leaves off. And that’s not because Muck Rack’s reporting is bad, but because it was built for a different purpose.
For most PR teams, the question isn’t which one to use.
It’s whether you’re leaving value on the table by not using both.
Try CoverageBook freefor 30 days and see how long it takes to build your first report from a Muck Rack export.